SPL Reference

Public Measurement Library

Explore sound-level measurements shared by the community. Every entry links to its complete public record for transparent review.

Measure your environment. Share what you find.

Use SPL Reference to capture the sound around you and publish a measurement for the community to explore.

Download SPL Reference on the App Store
Measurements
34
Public locations
32
Data licence
CC BY 4.0

Measurements

34 results

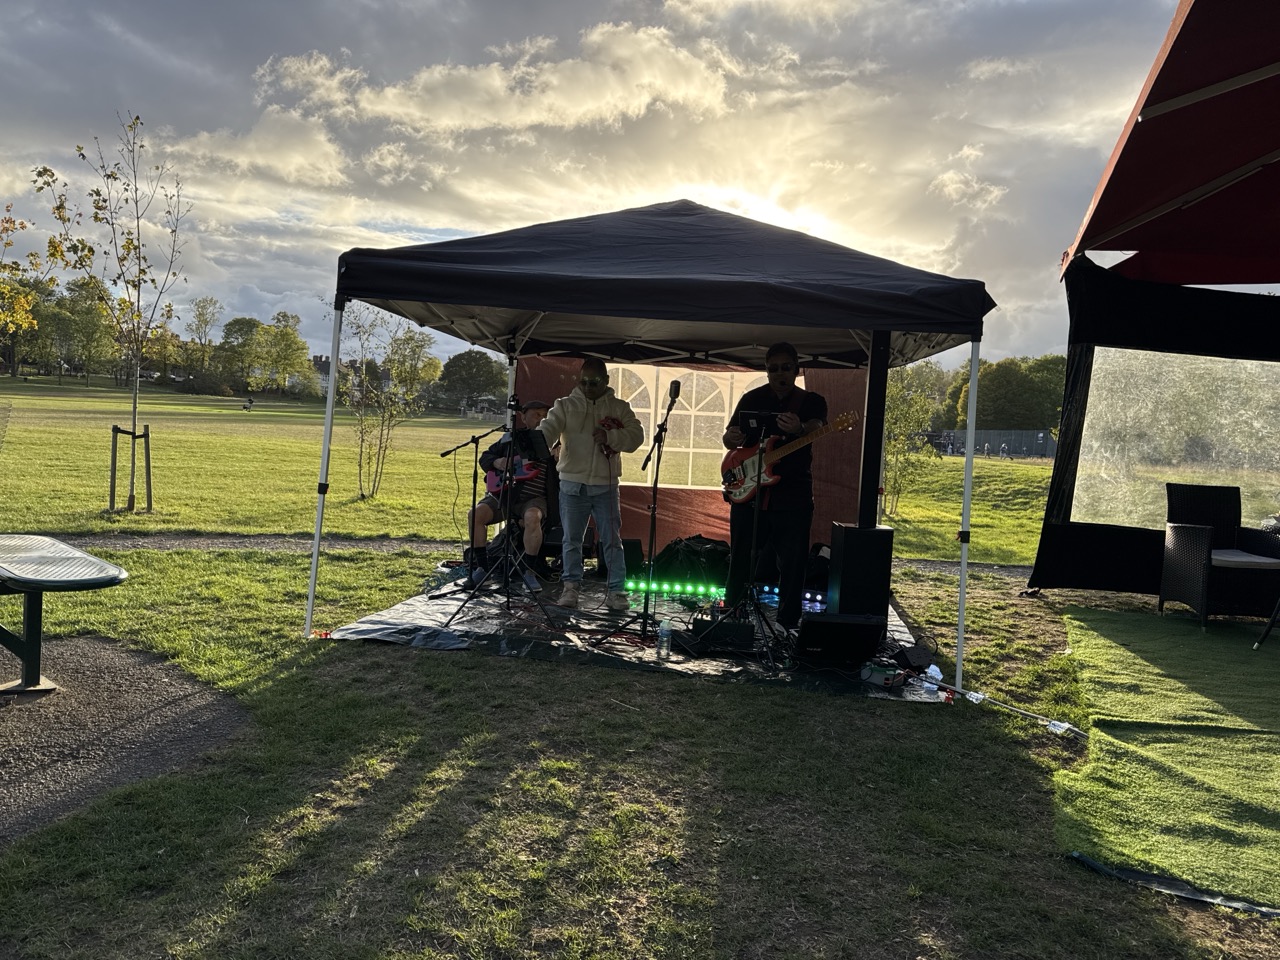
Public photograph for Band In South Norwood Lake
National Park

Band In South Norwood Lake

South Norwood Lake, United Kingdom

LAeq
92.3 dB
LAFmax
102.9 dB
LCpeak
113.7 dB
Duration
1:10
Measurement details
Environment
Nature Outdoors · National Park
LAFmin
79.5 dB
LCeq
94.5 dB
LZeq
94.6 dB
Calibration
Uncalibrated
Quality
Indicative
Contributor
Anonymous
Licence
CC BY 4.0

A walk through South Norwood Lake Park, a friendly trio playing live music, and people enjoying a drink at the nearby kiosk. What could be more relaxing? Standing just 5–6 metres from the musicians, I was surprised when SPL Reference displayed a “Loud” warning with a potential hearing-risk indication. The performance combined backing tracks with live guitars and vocals, creating an energetic soundscape that felt perfectly natural in such a pleasant setting. But this raises an interesting question: how often do we underestimate our sound exposure simply because we're enjoying ourselves? For visitors stopping briefly, the exposure may be limited. But what about those spending hours at the drinks kiosk, or the musicians performing throughout the afternoon? A reminder that hearing risk depends not only on how loud something sounds, but also on how long we are exposed to it. Enjoyable music is still acoustic energy, and our ears don't distinguish between sounds we love and sounds we dislike. Environment: Outdoor park / live music Sound sources: Backing tracks, guitars and vocals Distance: Approximately 5–6 metres from performers Measurement type: Recreational sound exposure / live music

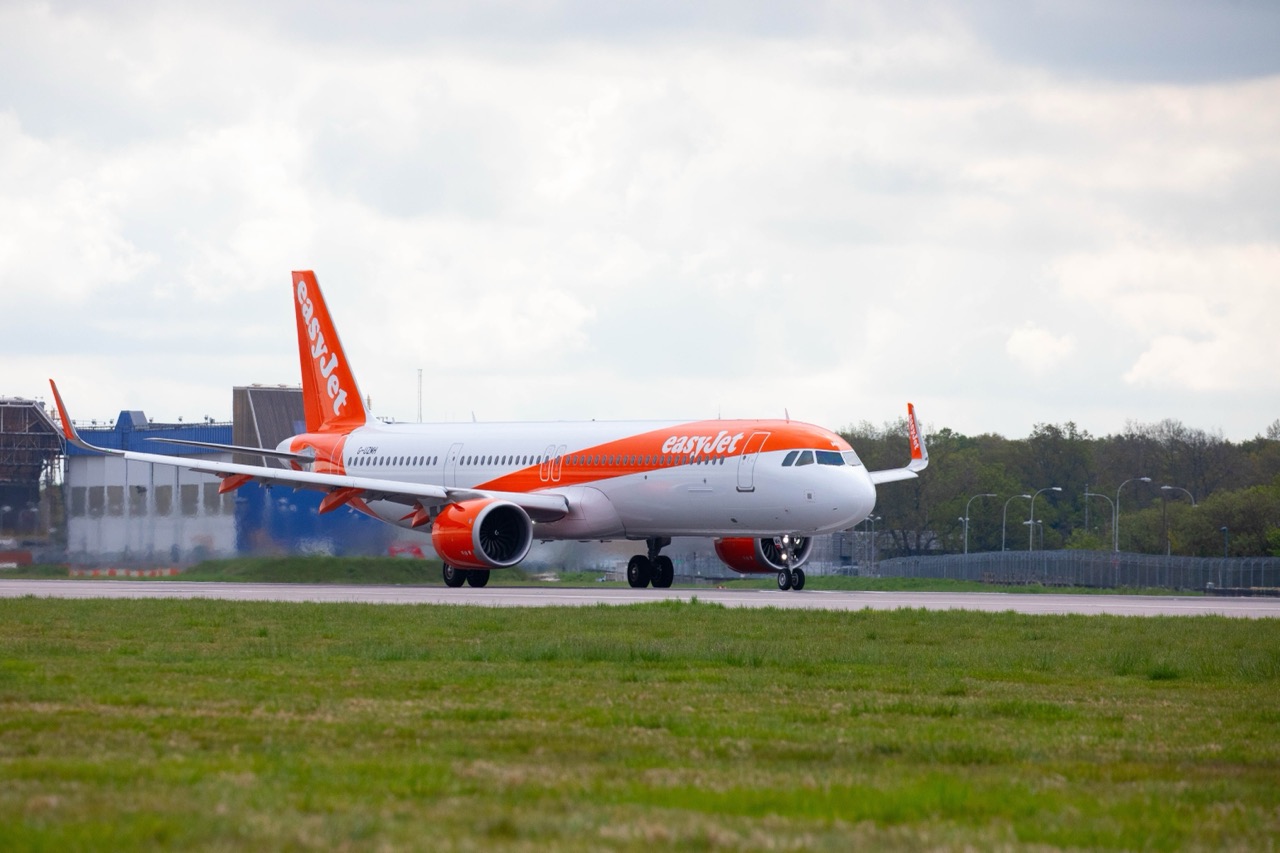
Public photograph for From Milan to London — How Loud Is Takeoff?
Aircraft

From Milan to London — How Loud Is Takeoff?

Milan, Italy

LAeq
81.8 dB
LAFmax
90.2 dB
LCpeak
119.8 dB
Duration
2:57
Measurement details
Environment
Transport · Aircraft
LAFmin
72.3 dB
LCeq
96.7 dB
LZeq
99.5 dB
Calibration
Calibrated
Quality
Device Calibrated
Contributor
Michelangelo Canonico · Direct Sound Records
Licence
CC BY 4.0

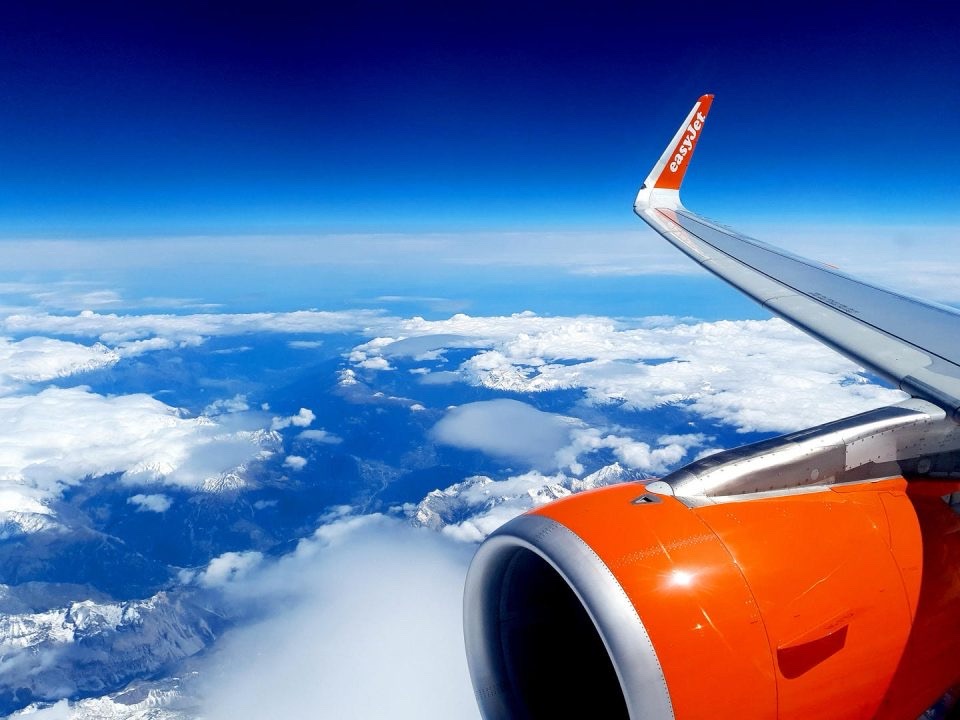
After presenting SPL Reference at the Hi-Fidelity show in Milan, there was one more opportunity to put the app to work: the flight home to London. This measurement captures takeoff from inside the aircraft cabin, from the acceleration along the runway through lift-off and the initial climb. Engine thrust, aerodynamic noise and vibration combine to create one of the most energetic acoustic phases of a flight. The interesting question is the comparison: how much louder is takeoff than the steady noise we experience during cruise? We tend to notice the drama of takeoff, but a shorter, louder event and several hours of continuous cabin noise represent very different kinds of sound exposure. A fitting final measurement for the Milan trip: using the same app presented to the Hi-Fi community to measure the journey home. Environment: Aircraft cabin Journey: Milan → London Event: Takeoff and initial climb Measurement type: Transport / personal sound exposure

Public photograph for How Does the Sound of a Flight Change During Landing?
Aircraft

How Does the Sound of a Flight Change During Landing?

Milan, Italy

LAeq
78.6 dB
LAFmax
92.7 dB
LCpeak
114.1 dB
Duration
3:45
Measurement details
Environment
Transport · Aircraft
LAFmin
67.7 dB
LCeq
92.6 dB
LZeq
95.7 dB
Calibration
Calibrated
Quality
Device Calibrated
Contributor
Anonymous
Licence
CC BY 4.0
Public photograph for Flight EasyJet Gatwick - Milan
Aircraft

Flight EasyJet Gatwick - Milan

Milan, Italy

LAeq
76.8 dB
LAFmax
80.6 dB
LCpeak
102.7 dB
Duration
4:21
Measurement details
Environment
Transport · Aircraft
LAFmin
75.3 dB
LCeq
87.7 dB
LZeq
88.6 dB
Calibration
Calibrated
Quality
Device Calibrated
Contributor
Anonymous
Licence
CC BY 4.0
Public photograph for Same Car, Same Speed — A 10 dB Difference
Car

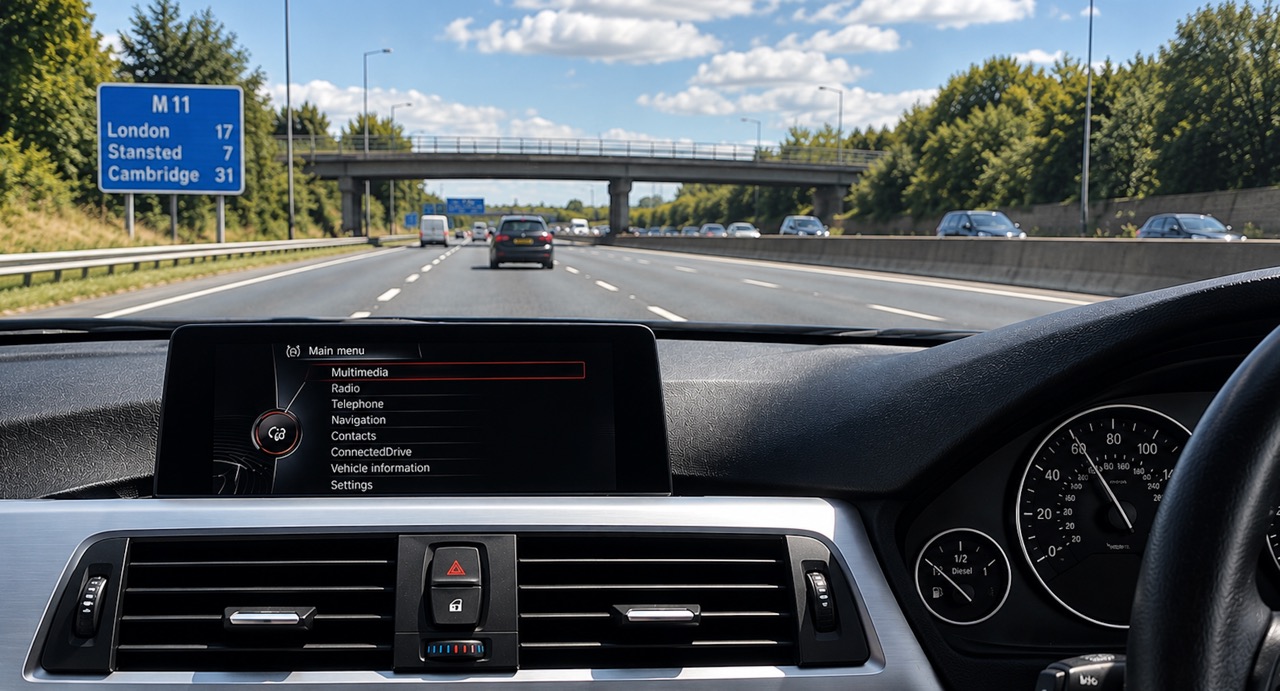
Same Car, Same Speed — A 10 dB Difference

Cambridge, United Kingdom

LAeq
66.0 dB
LAFmax
71.6 dB
LCpeak
91.2 dB
Duration
0:02
Measurement details
Environment
Transport · Car
LAFmin
61.4 dB
LCeq
70.5 dB
LZeq
70.9 dB
Calibration
Uncalibrated
Quality
Indicative
Contributor
Michelangelo Canonico
Licence
CC BY 4.0
Public photograph for When Music Becomes an Exposure
Live Music Venue

When Music Becomes an Exposure

Cambridge, United Kingdom

LAeq
99.7 dB
LAFmax
106.2 dB
LCpeak
125.8 dB
Duration
0:49
Measurement details
Environment
Music Nightlife · Live Music Venue
LAFmin
89.6 dB
LCeq
106.0 dB
LZeq
106.1 dB
Calibration
Uncalibrated
Quality
Indicative
Contributor
Michelangelo Canonico
Licence
CC BY 4.0

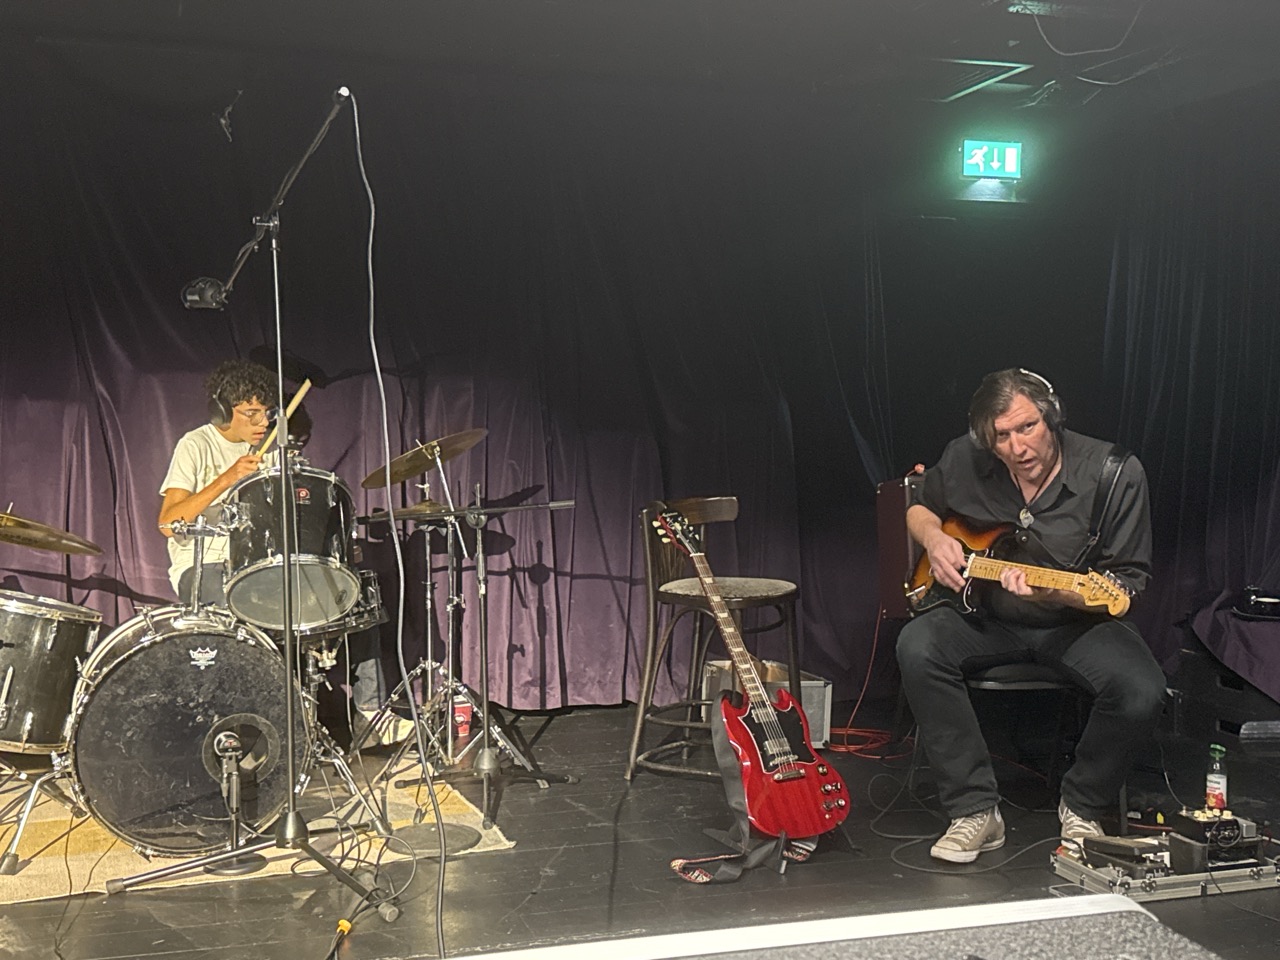
A recording session is about listening carefully — but how long can we listen when the monitoring level becomes part of the experience? During this session, SPL Reference measured 99.7 dB LAeq, 106 dB LCeq, 106.2 dB LAFmax, with a 125.8 dB LCpeak. The striking number here is not simply the peak: an LAeq close to 100 dB means the average acoustic energy remained very high throughout the measured period. For perspective, NIOSH's 3 dB exchange-rate guidance gives approximately 15 minutes at 100 dBA as the daily exposure corresponding to its recommended occupational limit. Beyond that, accumulated exposure rises rapidly. CDC Interestingly, the 125.8 dB(C) peak is below the UK's workplace lower peak action value of 135 dB(C); it is the sustained level that deserves particular attention here. HSE For musicians, engineers and producers, this is an important reminder: a session can sound fantastic and still represent substantial noise exposure. Monitoring level and listening time are part of the recording environment too.

Public photograph for What Does 30 dB Sound Like?
Home

What Does 30 dB Sound Like?

Cambridge, United Kingdom

LAeq
30.8 dB
LAFmax
36.2 dB
LCpeak
56.4 dB
Duration
1:38
Measurement details
Environment
Residential · Home
LAFmin
30.0 dB
LCeq
34.6 dB
LZeq
35.8 dB
Calibration
Uncalibrated
Quality
Indicative
Contributor
Michelangelo Canonico
Licence
CC BY 4.0

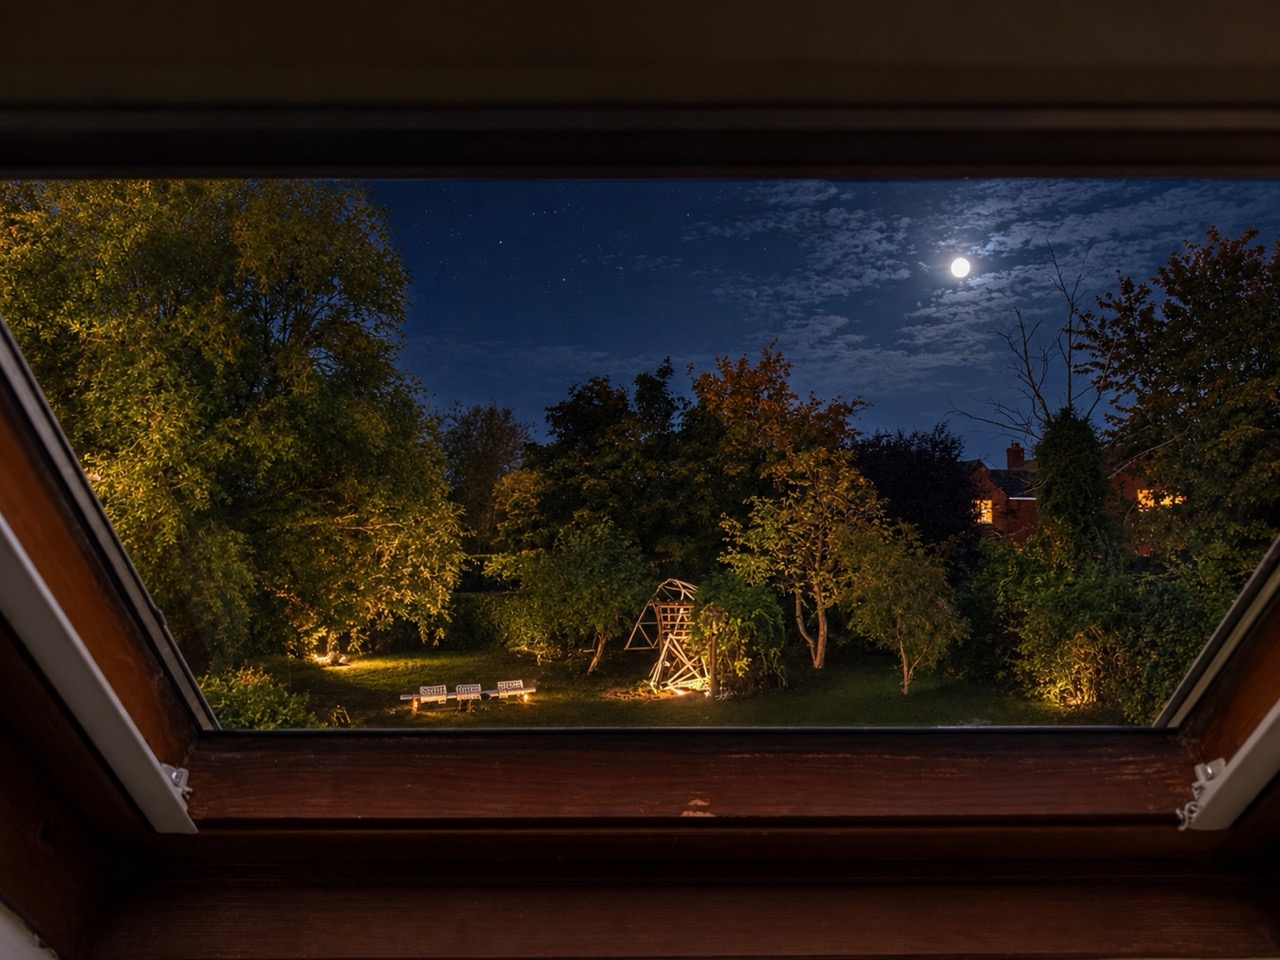
Late at night, from a loft overlooking the garden, the world seems to have almost switched itself off. This SPL Reference measurement captured a background level of around 30 dB — no traffic demanding attention, no conversations, no machinery; just the faint acoustic traces of an environment that feels virtually silent. And that is perhaps the interesting part: absolute silence is not zero decibels. Even when we perceive silence, there is still a measurable soundscape around us. A quiet reference point for the SPL Reference collection — and a reminder of just how different 30 dB feels after a day surrounded by the sound of the city.

Public photograph for When Great Food Meets a Loud Room
Restaurant

When Great Food Meets a Loud Room

Cambridge, United Kingdom

LAeq
87.1 dB
LAFmax
105.0 dB
LCpeak
119.1 dB
Duration
9:36
Measurement details
Environment
Food Drink · Restaurant
LAFmin
73.7 dB
LCeq
88.6 dB
LZeq
88.7 dB
Calibration
Uncalibrated
Quality
Indicative
Contributor
Anonymous
Licence
CC BY 4.0

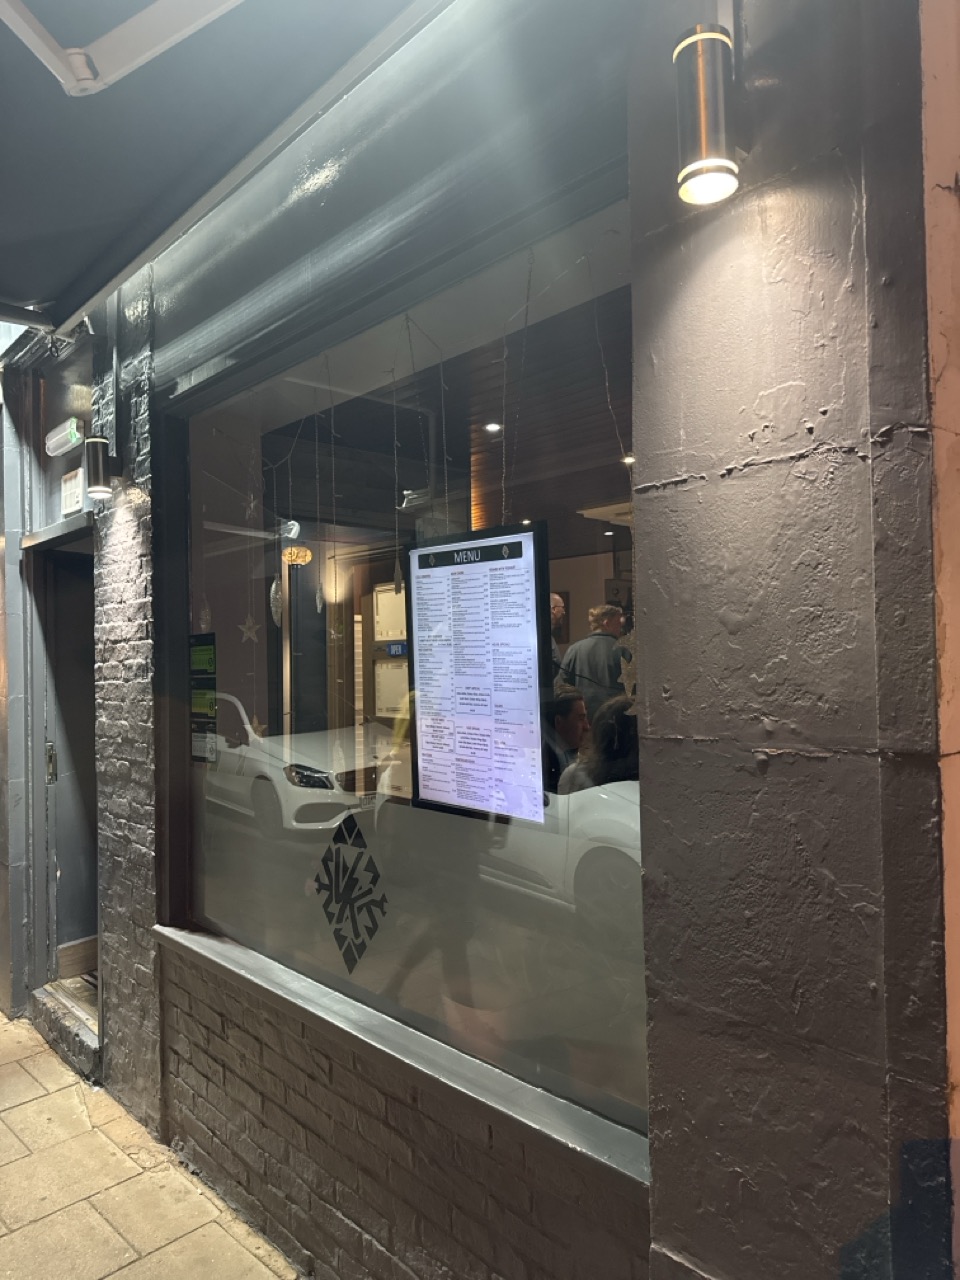
Excellent food, lively conversation, a busy dining room — and a sound level that made relaxing surprisingly difficult. This SPL Reference measurement was taken during dinner in a Turkish restaurant, where conversations, music, service and the reflections of many simultaneous voices combined into a dense and energetic soundscape. Nothing was necessarily wrong with the atmosphere; the restaurant was simply very lively. Yet it raises an interesting question: at what point does a vibrant restaurant become acoustically tiring? A reminder that our experience of a restaurant is shaped not only by what is on the plate, but also by the environment in which we enjoy it.

Public photograph for How Much Sound Surrounds a Game of Tennis?
Tennis Court

How Much Sound Surrounds a Game of Tennis?

North Dulwich, United Kingdom

LAeq
62.3 dB
LAFmax
85.3 dB
LCpeak
104.2 dB
Duration
4:55
Measurement details
Environment
Sport Leisure · Tennis Court
LAFmin
48.4 dB
LCeq
68.6 dB
LZeq
69.5 dB
Calibration
Uncalibrated
Quality
Indicative
Contributor
Michelangelo Canonico
Licence
CC BY 4.0

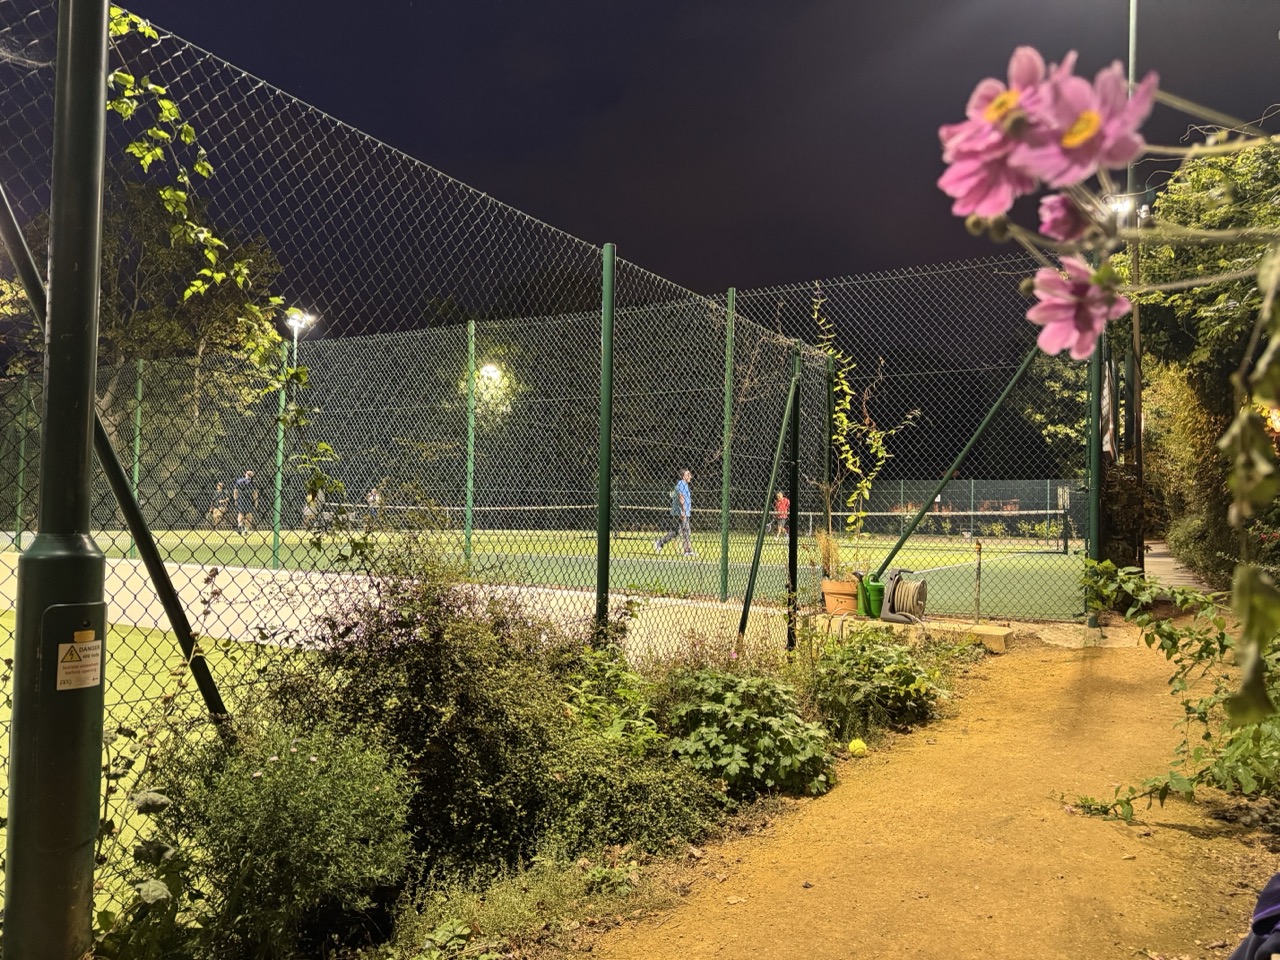
A few players on the courts, an otherwise peaceful outdoor setting — but how quiet is it really? This SPL Reference measurement captures the complete soundscape from outside the tennis courts: the rhythmic impact of balls and racquets, occasional voices from the players, periods of relative calm, wind passing through the area and, every so often, an aircraft crossing far overhead. None of these sounds necessarily dominates. Together, however, they reveal something interesting: even an environment we perceive as quiet is made from many layers of sound. A snapshot of an ordinary moment — and a reminder of just how much sound surrounds us without demanding our attention.

Public photograph for How Loud Is a Hydraulic Breaker?
Roadworks

How Loud Is a Hydraulic Breaker?

City Of London, United Kingdom

LAeq
98.7 dB
LAFmax
106.5 dB
LCpeak
125.1 dB
Duration
1:09
Measurement details
Environment
Construction · Roadworks
LAFmin
75.9 dB
LCeq
99.2 dB
LZeq
99.6 dB
Calibration
Uncalibrated
Quality
Indicative
Contributor
Anonymous
Licence
CC BY 4.0

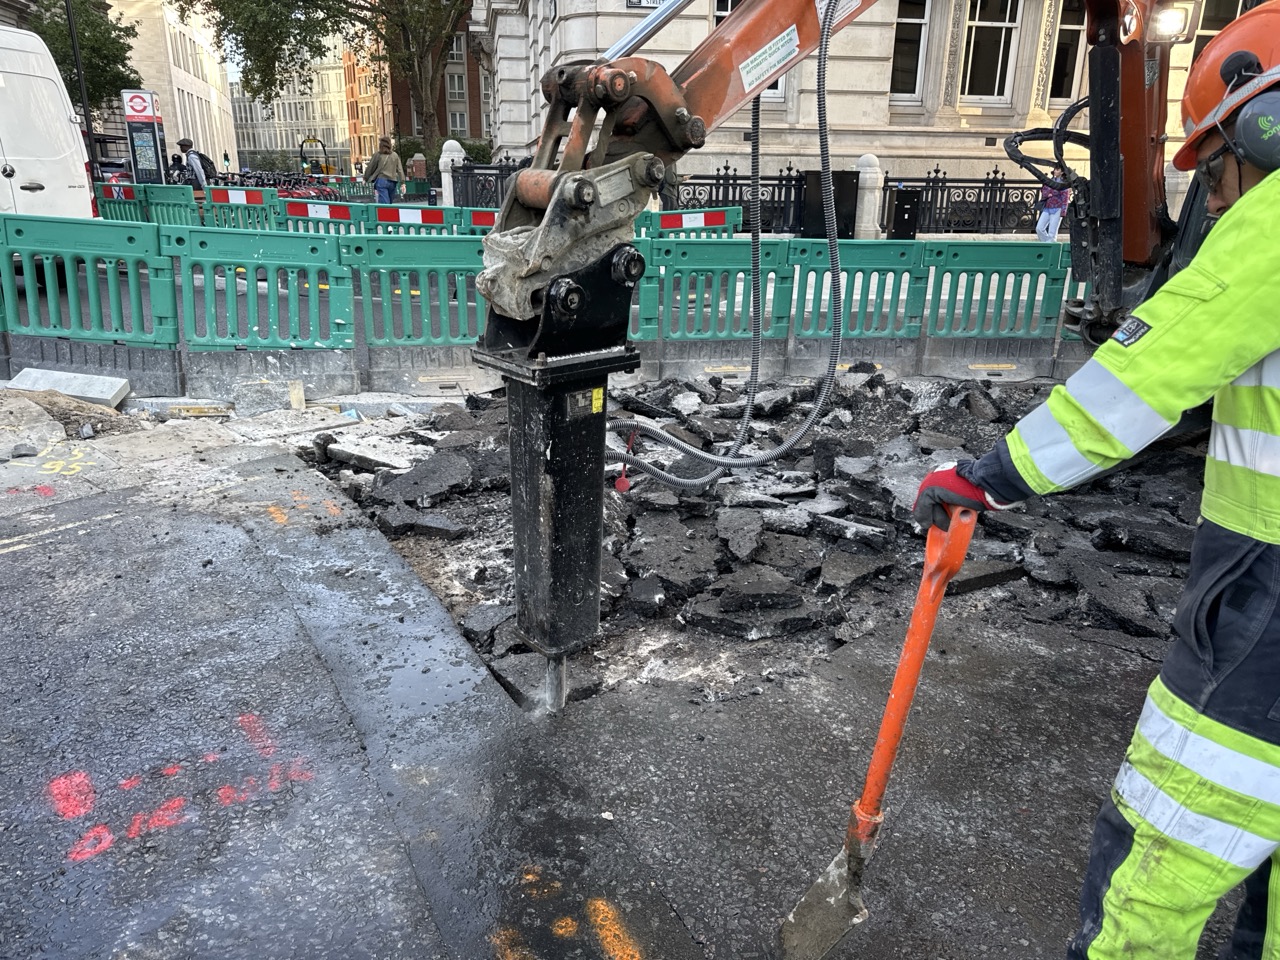
You can hear it long before you reach the roadworks. This measurement captures an excavator-mounted hydraulic breaker breaking the road surface at close range. What surprised me wasn’t only the level — around 100 dB during the measurement — but how persistent the sound remained and how clearly it could still be heard well beyond the immediate work area. The workers nearby were wearing hearing protection, and for good reason: at these levels, duration becomes as important as loudness. For a pedestrian, the exposure may last only seconds; for the people operating the machinery, it can be part of an entire working day. A striking example of how one relatively localised source can temporarily change the acoustic environment of a much larger part of a city street.

Public photograph for How Far Does the Sound of a Stadium Travel?
Stadium

How Far Does the Sound of a Stadium Travel?

Croydon, United Kingdom

LAeq
72.5 dB
LAFmax
86.6 dB
LCpeak
113.0 dB
Duration
0:41
Measurement details
Environment
Sport Leisure · Stadium
LAFmin
62.1 dB
LCeq
87.6 dB
LZeq
90.6 dB
Calibration
Calibrated
Quality
Device Calibrated
Contributor
Anonymous
Licence
CC BY 4.0

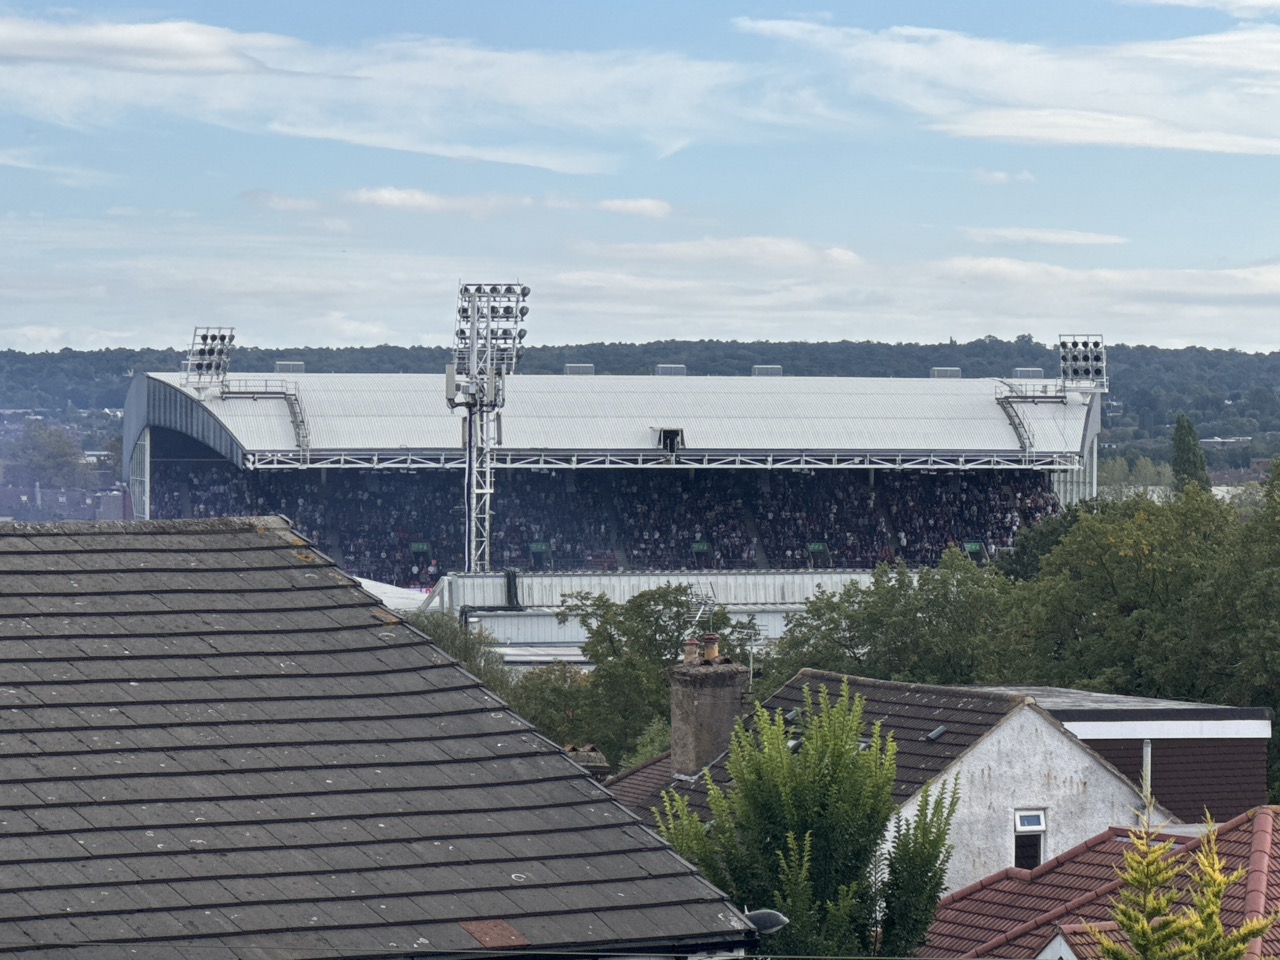
You don’t need to be inside a football stadium to experience the match. This SPL Reference measurement was taken at a distance from a stadium during a football match, capturing the crowd as part of the surrounding soundscape. From afar, thousands of individual voices merge into a continuous background presence, punctuated by moments when the crowd suddenly reacts as one. It’s an interesting way to measure not just how loud a stadium is, but how far its acoustic footprint extends into the surrounding environment. Environment: Outdoor / urban Source: Football stadium and crowd, measured at a distance Measurement type: Community / environmental noise

Public photograph for Small Speaker - Very Big Low End
Hifi Demo Room

Small Speaker - Very Big Low End

Heathrow, United Kingdom

LAeq
84.4 dB
LAFmax
92.4 dB
LCpeak
107.9 dB
Duration
2:36
Measurement details
Environment
Music Nightlife · Hifi Demo Room
LAFmin
61.5 dB
LCeq
90.2 dB
LZeq
90.8 dB
Calibration
Uncalibrated
Quality
Indicative
Contributor
Michelangelo Canonico · Direct Sound Records
Licence
CC BY 4.0

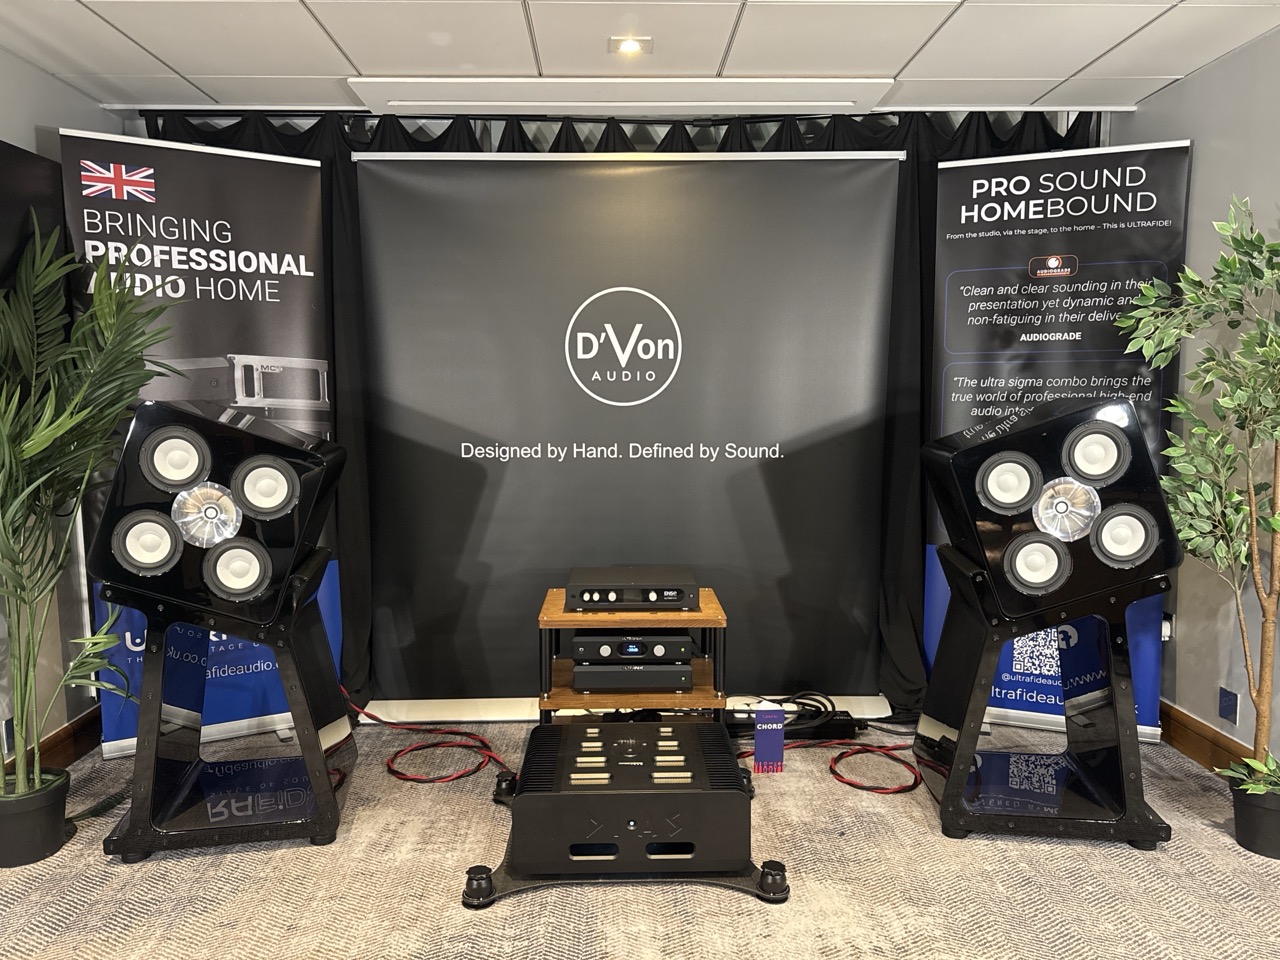
Small Speaker. Very Big Low End. This one wasn’t really about how loud the demonstration was, but about what was happening at the bottom of the spectrum. During a demonstration by D’Von Audio, SPL Reference captured a remarkably extended and controlled low-frequency response from a relatively compact **pre-production loudspeaker. In the conditions of this demonstration, the measured response extended to around 24 Hz, remaining impressively linear— an unexpected result from a speaker of this size. More interesting than sheer bass quantity was the way the system managed the low end dynamically: depth, control and extension without the bass simply dominating the presentation. A good reminder of why at DSR we like to put measurements alongside listening impressions: sometimes what surprises the ears becomes even more interesting when you can see what is happening.

Public photograph for How Loud Is “Quality”?
Hifi Demo Room

How Loud Is “Quality”?

Heathrow, United Kingdom

LAeq
84.1 dB
LAFmax
94.2 dB
LCpeak
108.0 dB
Duration
0:28
Measurement details
Environment
Music Nightlife · Hifi Demo Room
LAFmin
74.0 dB
LCeq
92.1 dB
LZeq
92.5 dB
Calibration
Uncalibrated
Quality
Indicative
Contributor
Michelangelo Canonico · Direct Sound Records
Licence
CC BY 4.0

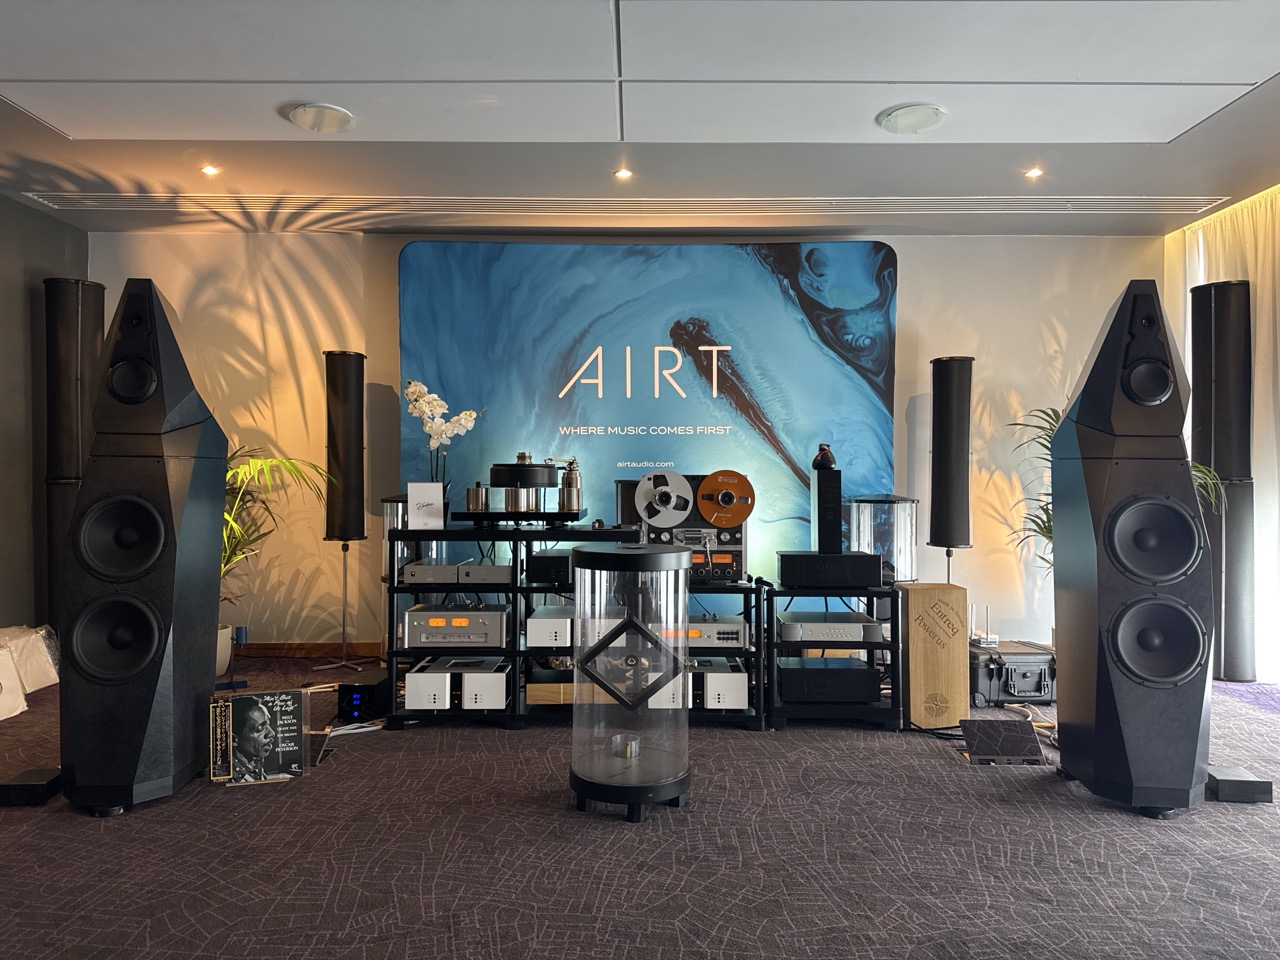
At a Hi-Fi show, we often talk about resolution, dynamics, realism and soundstage — but rarely about the actual level at which those qualities are being demonstrated. This measurement, taken during a listening session at the HiFi Stereo NET Show at Heathrow, looks at the SPL behind the experience. A system may sound effortless and refined even at a high level, which can make the true exposure less obvious than with harsher or more distorted playback. That makes the question interesting: does better sound quality make loud listening feel more comfortable — and therefore easier to underestimate? A small real-world measurement linking perceived quality, playback level and listening exposure. Curtesy Airt

Public photograph for How Loud Is Hi-Fi at an Audio Show?
Hifi Demo Room

How Loud Is Hi-Fi at an Audio Show?

Heathrow, United Kingdom

LAeq
82.3 dB
LAFmax
91.5 dB
LCpeak
108.5 dB
Duration
1:03
Measurement details
Environment
Music Nightlife · Hifi Demo Room
LAFmin
57.0 dB
LCeq
88.8 dB
LZeq
89.0 dB
Calibration
Uncalibrated
Quality
Indicative
Contributor
Michelangelo Canonico · Direct sound records
Licence
CC BY 4.0

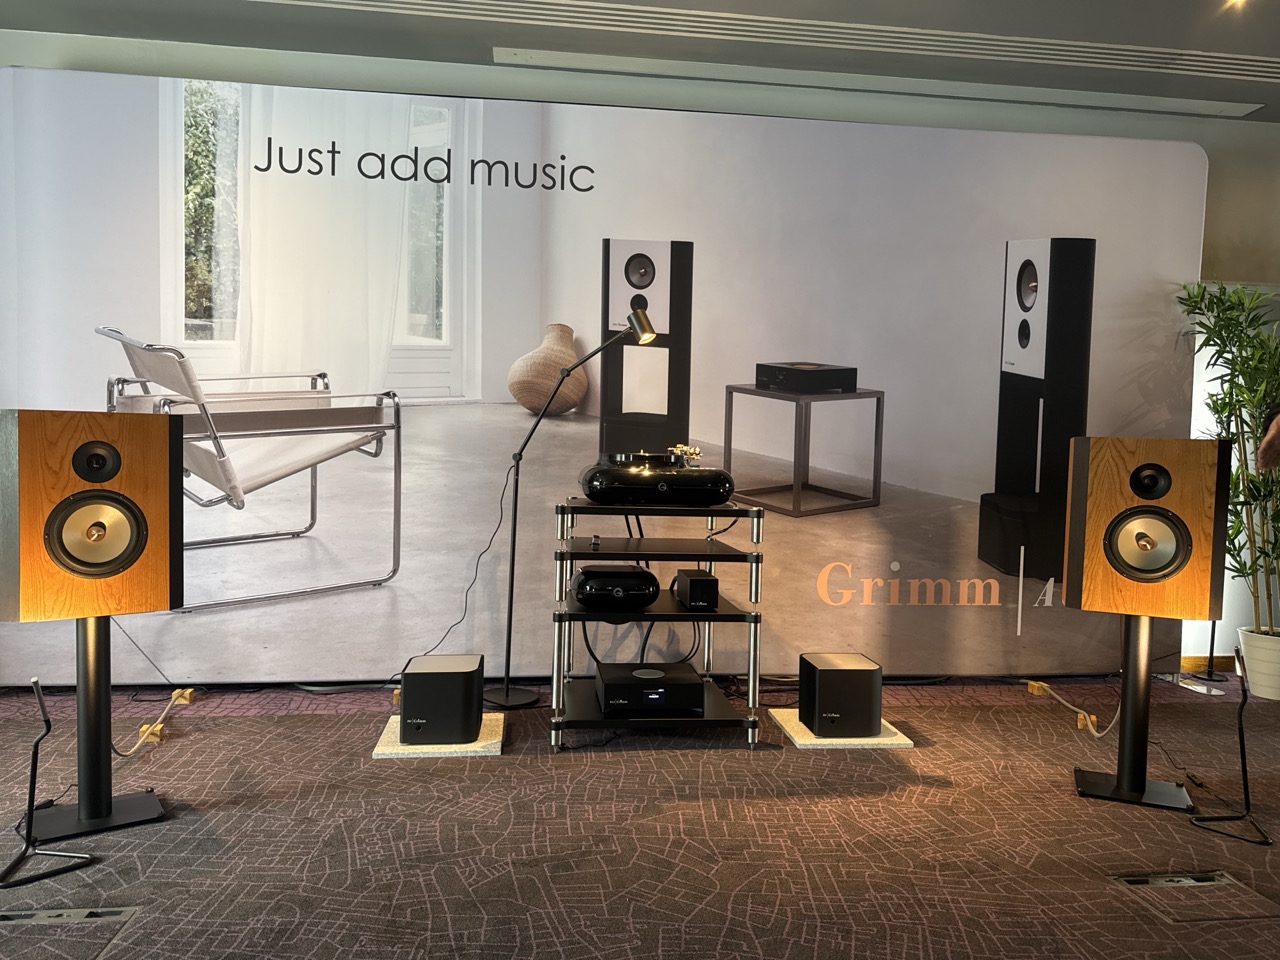
A listening session at the HiFi Stereo NET Show at Heathrow offers a very different experience from listening at home. Systems are demonstrated in unfamiliar rooms, with visitors coming and going, conversations outside or inside the room, and exhibitors often choosing generous playback levels to reveal dynamics, impact and the capabilities of the system. This SPL Reference measurement captures the actual sound exposure during a typical show listening session. How does it compare with a relaxed evening at home? Are we listening louder than we realise when the system, the music and the atmosphere encourage us to turn it up? A useful real-world reference connecting Hi-Fi performance, listening habits and sound exposure — because evaluating how a system sounds is only part of the story; knowing how loudly we are experiencing it adds another dimension. Environment: Hi-Fi show / demonstration room Activity: Music listening Purpose: Listening-level and exposure reference. Image courtesy: Reference Audio

Public photograph for How Nature Sounds Outside The Big City
Urban Park

How Nature Sounds Outside The Big City

Croydon, United Kingdom

LAeq
61.0 dB
LAFmax
73.9 dB
LCpeak
106.0 dB
Duration
1:45
Measurement details
Environment
Nature Outdoors · Urban Park
LAFmin
48.9 dB
LCeq
78.6 dB
LZeq
79.9 dB
Calibration
Uncalibrated
Quality
Indicative
Contributor
Anonymous
Licence
CC BY 4.0

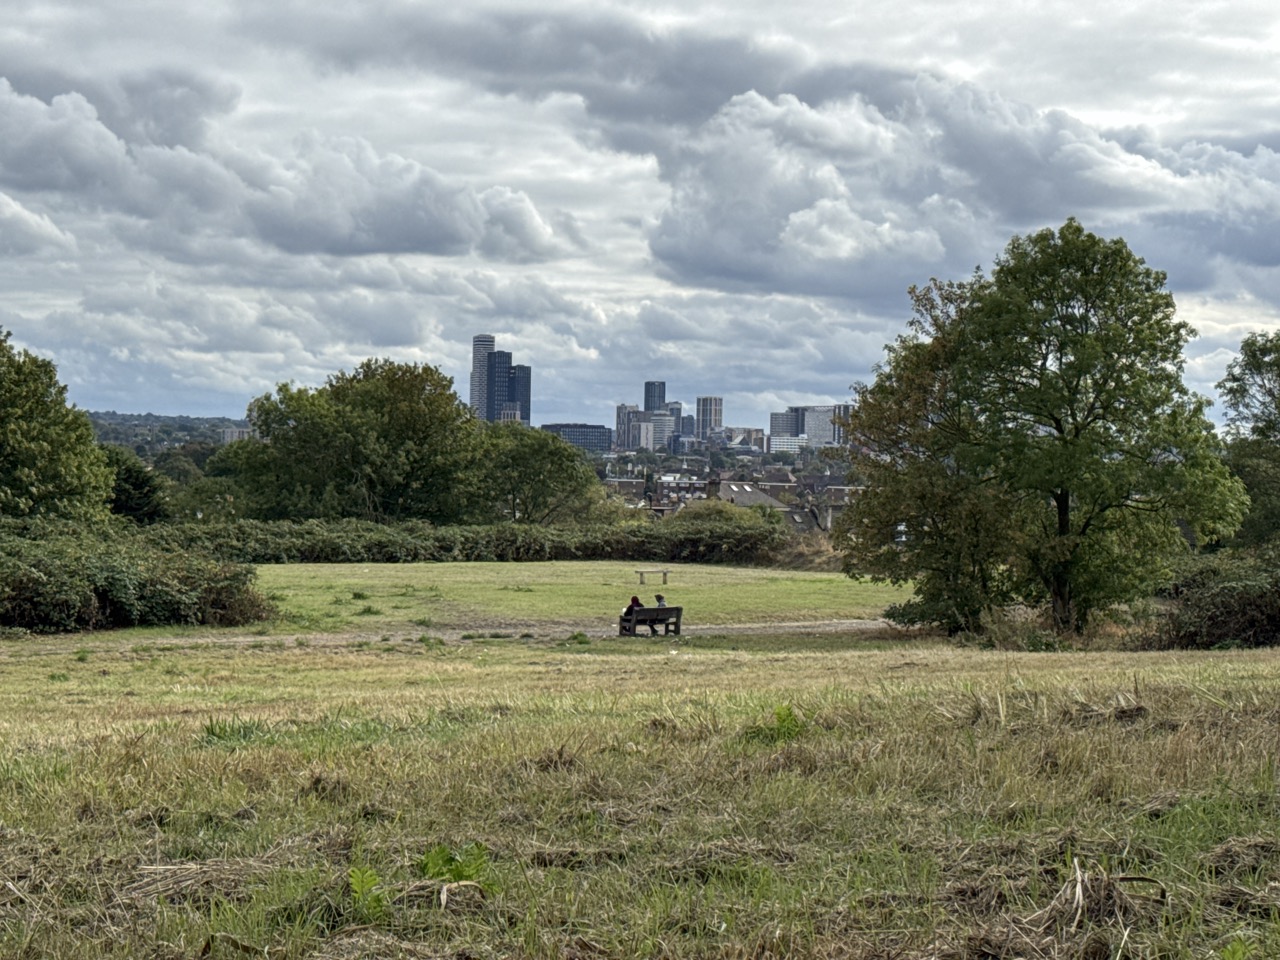
Step away from the city and the soundscape changes — but the city doesn’t completely disappear. This short measurement captures the natural background of an open outdoor environment: a gentle breeze, subtle sounds from the surrounding landscape, and, far on the horizon, the faint but persistent acoustic presence of the city. It’s an interesting reference for SPL Reference: quiet is rarely silence. Even when individual sounds are barely noticeable, together they create the acoustic baseline of a place.

Public photograph for How Loud Is an Involving Hi-Fi Listening Session?
Hifi Listening Room

How Loud Is an Involving Hi-Fi Listening Session?

Location withheld

LAeq
78.7 dB
LAFmax
89.1 dB
LCpeak
102.6 dB
Duration
9:37
Measurement details
Environment
Music Nightlife · Hifi Listening Room
LAFmin
58.3 dB
LCeq
84.6 dB
LZeq
85.2 dB
Calibration
Uncalibrated
Quality
Indicative
Contributor
Anonymous
Licence
CC BY 4.0

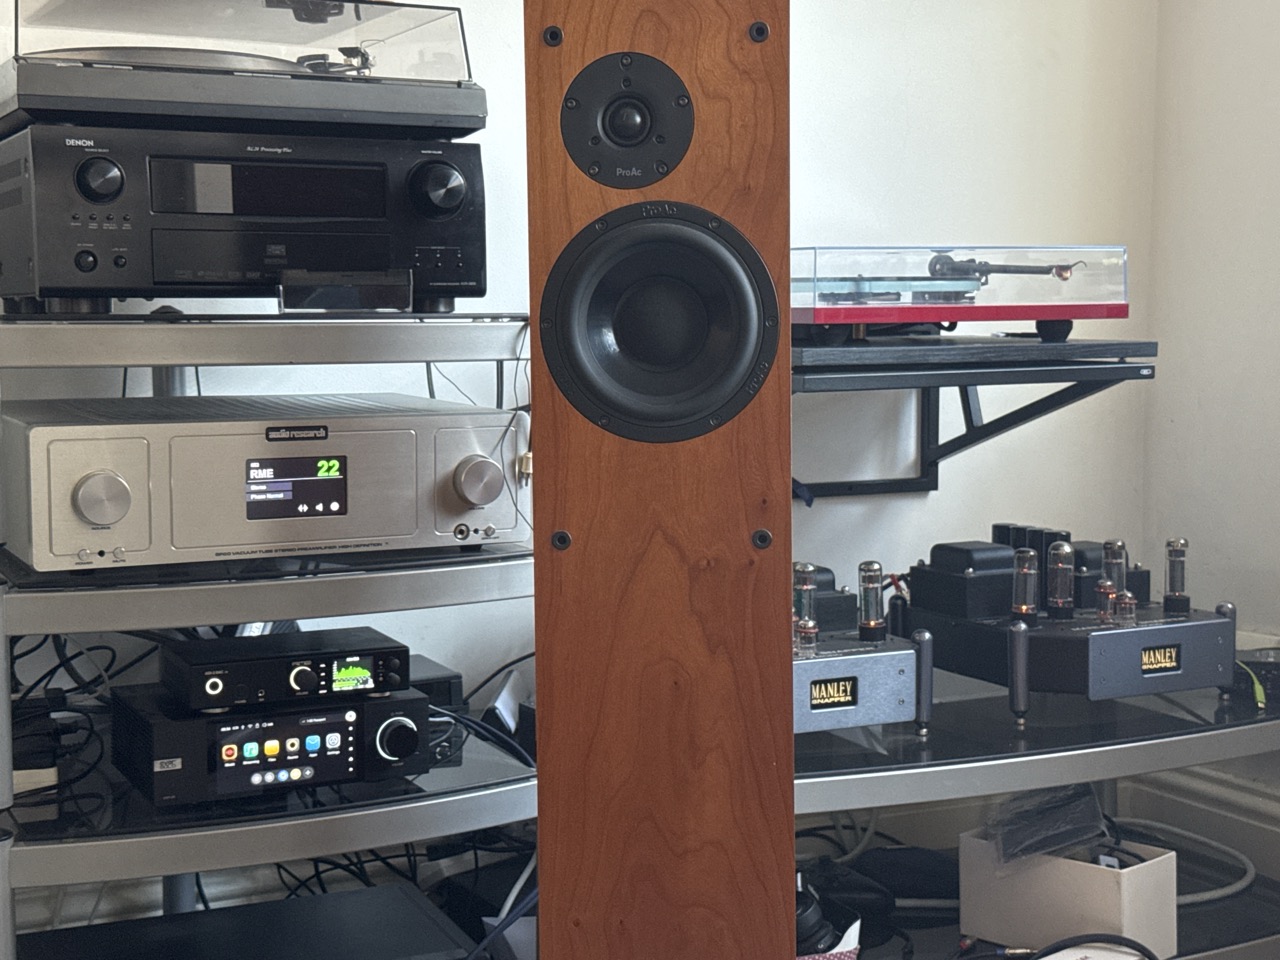
A high-quality Hi-Fi system can make music feel remarkably present — but how loud are we actually listening when we turn the volume up for a truly involving experience? This measurement was taken during a listening session of Charlie Haden’s The Montreal Tapes: with Paul Bley and Paul Motian at a deliberately high playback level. The result was powerful and engaging, although still below the level I would consider realistic for recreating the scale and dynamics of a live performance. Beyond evaluating the system, this measurement asks a different question: what level of sound exposure are we accumulating during serious music listening? SPL, listening duration and musical dynamics all matter when considering exposure; a short peak and an hour spent listening at an elevated average level are very different things. For DSR, this is where Hi-Fi and measurement meet: not simply asking whether a system sounds good, but measuring the conditions under which we experience it. The same approach extends across playback setup, resonance, speed, vibration, room behaviour and acoustic level — turning subjective listening observations into something that can also be documented and compared. Source: Eversolo A6 - HiRes 192KHz Preamplifier: Audio Research SP20 Power Amplifiers: Manley Snapper Speakers: Proac D28

Public photograph for One Minute Standing On London Bridge
Urban Street

One Minute Standing On London Bridge

London, United Kingdom

LAeq
68.1 dB
LAFmax
78.0 dB
LCpeak
105.8 dB
Duration
1:11
Measurement details
Environment
Streets Roads · Urban Street
LAFmin
62.5 dB
LCeq
83.8 dB
LZeq
87.1 dB
Calibration
Calibrated
Quality
Device Calibrated
Contributor
Anonymous
Licence
CC BY 4.0

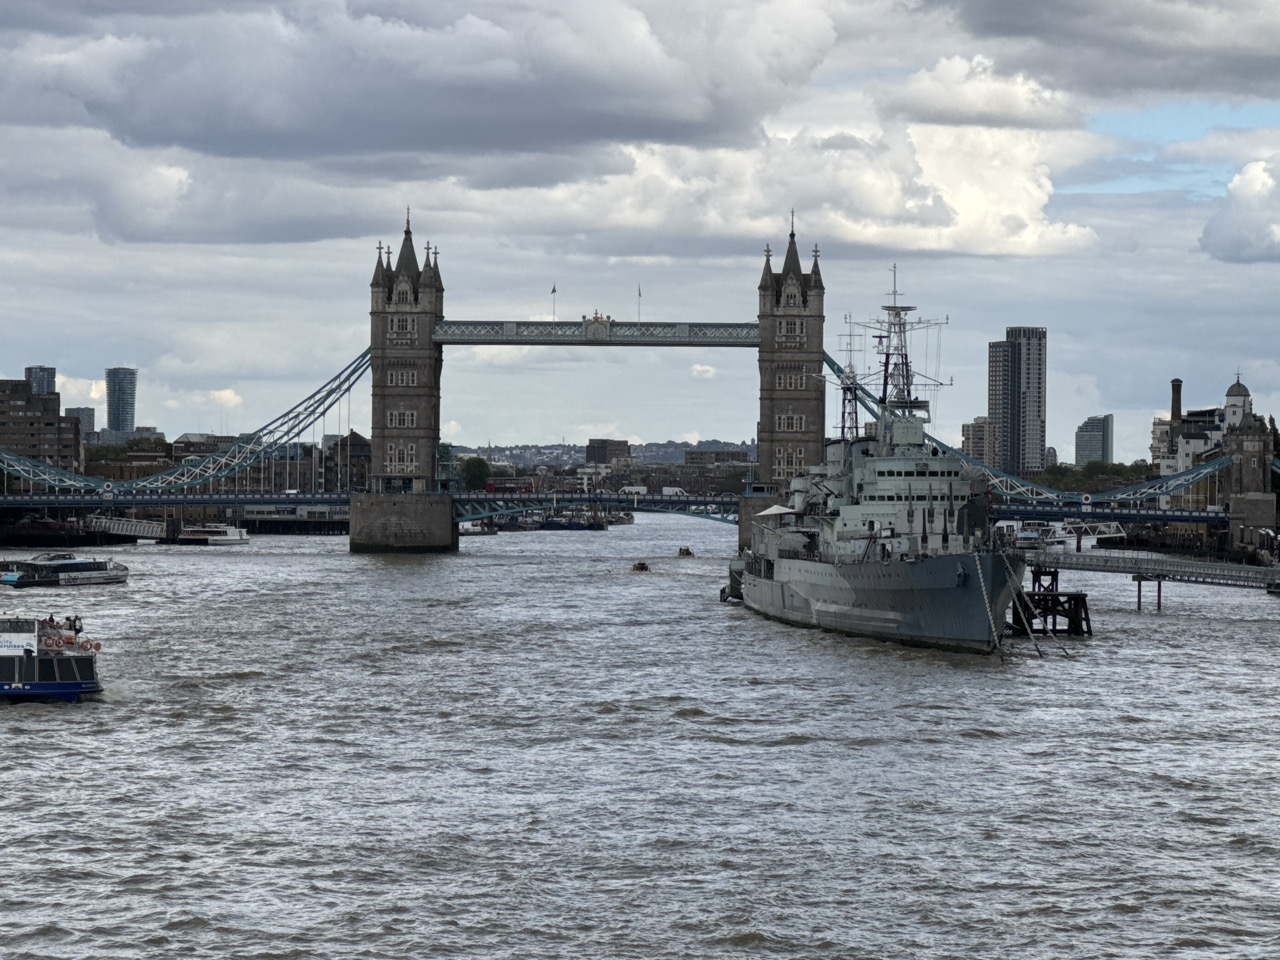
A beautiful view doesn’t necessarily come with a quiet soundtrack. This one-minute measurement, taken from London Bridge while looking towards Tower Bridge, captures the acoustic reality behind one of London’s iconic views: traffic, people, the city in motion and the constant urban background all blending together. Just one minute standing still — how loud does London sound when you actually measure it?

Public photograph for Walk Between Saint Paul And monument (quite)
Urban Street

Walk Between Saint Paul And monument (quite)

London, United Kingdom

LAeq
71.9 dB
LAFmax
90.5 dB
LCpeak
114.1 dB
Duration
11:12
Measurement details
Environment
Streets Roads · Urban Street
LAFmin
57.5 dB
LCeq
83.2 dB
LZeq
85.1 dB
Calibration
Calibrated
Quality
Device Calibrated
Contributor
Michelangelo Canonico
Licence
CC BY 4.0

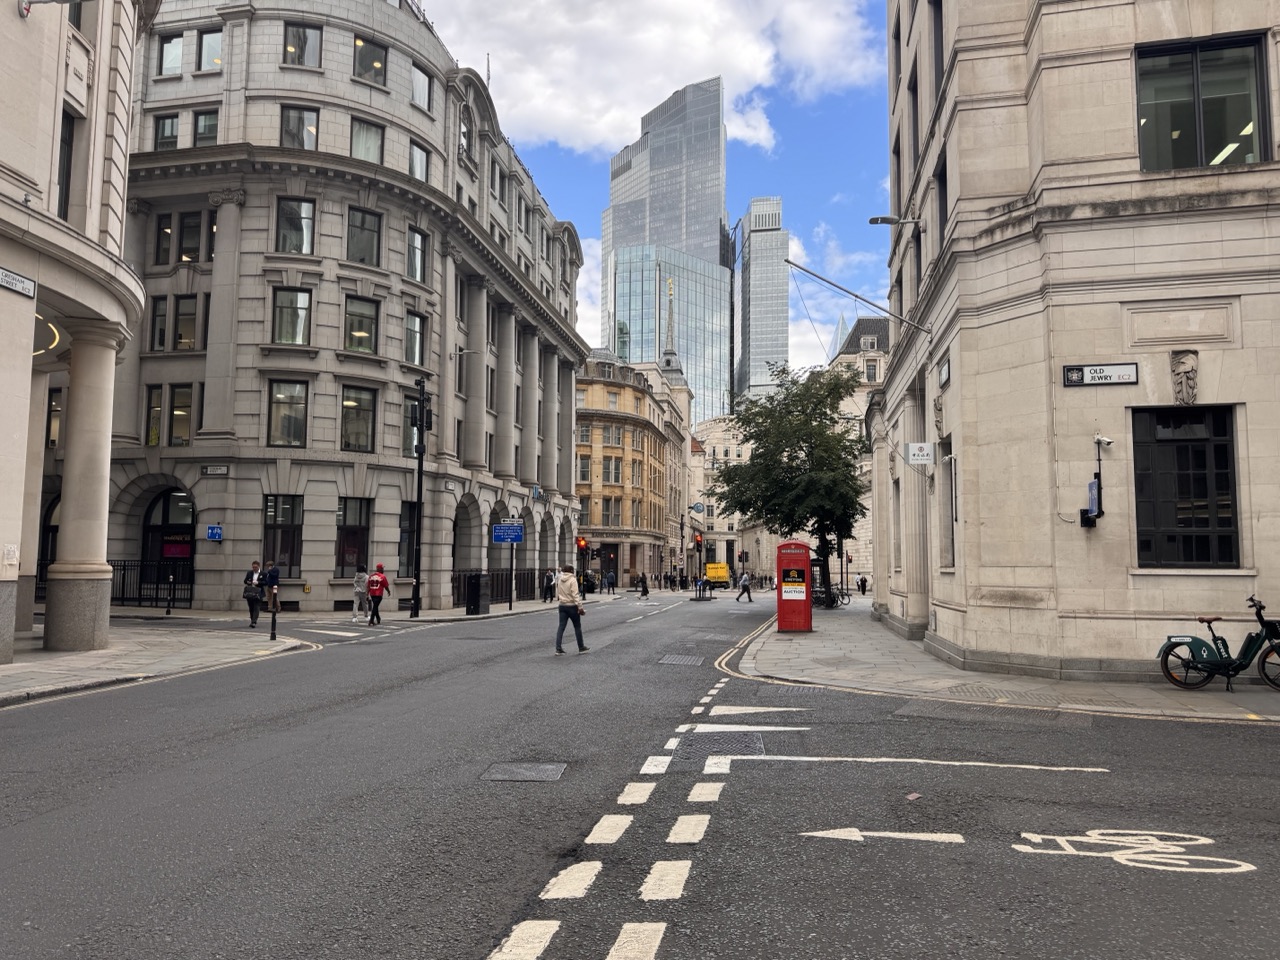
An 11-minute walk from St Paul’s to Monument on an unusually quiet day. Even in the heart of London, the soundscape isn’t always dominated by noise. Footsteps, distant traffic, occasional voices and passing activity come and go as the route moves through different streets. This measurement captures something easily overlooked: the quieter side of a major city, and how its sound changes simply by walking through it.

Public photograph for Road Work
Roadworks

Road Work

South Norwood, United Kingdom

LAeq
91.0 dB
LAFmax
96.9 dB
LCpeak
115.9 dB
Duration
1:03
Measurement details
Environment
Construction · Roadworks
LAFmin
86.5 dB
LCeq
95.8 dB
LZeq
96.1 dB
Calibration
Uncalibrated
Quality
Indicative
Contributor
Anonymous
Licence
CC BY 4.0

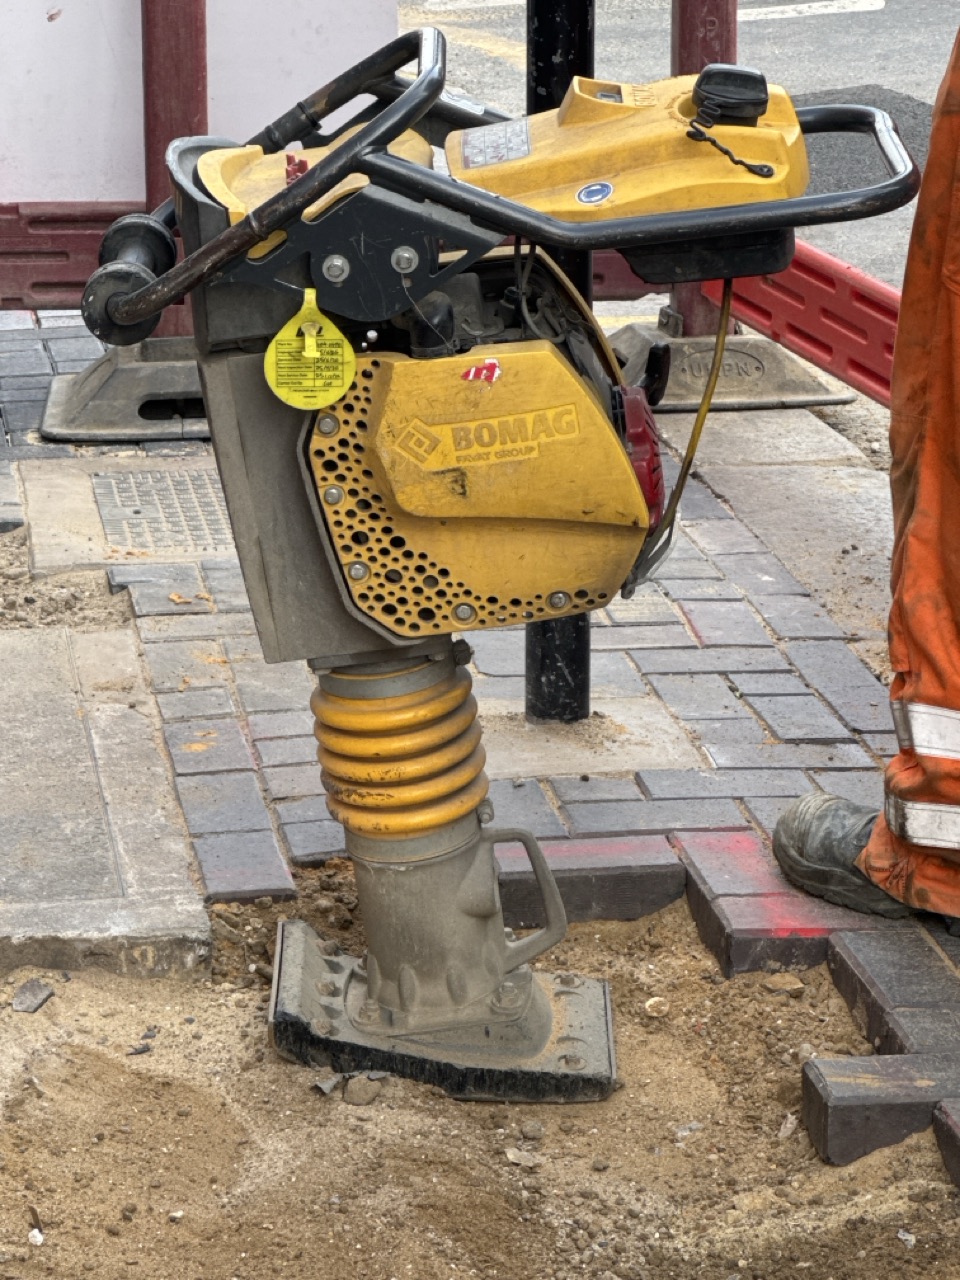
A short SPL Reference measurement capturing the noise produced by a vibratory rammer compacting the ground during roadworks. Its small size is deceptive: the combination of the engine, mechanical vibration and repeated impact with the ground creates a strong, persistent sound at close range. This measurement captures a brief real-world exposure from the perspective of someone passing or standing near the works. Environment: Urban roadworks Sound source: Vibratory rammer / compactor Measurement type: Real-world construction noise

Public photograph for Setting Up a scaffold In The City
Building Construction

Setting Up a scaffold In The City

City Of London, United Kingdom

LAeq
80.9 dB
LAFmax
93.9 dB
LCpeak
105.6 dB
Duration
0:49
Measurement details
Environment
Construction · Building Construction
LAFmin
64.6 dB
LCeq
80.9 dB
LZeq
81.5 dB
Calibration
Uncalibrated
Quality
Indicative
Contributor
Michelangelo Canonico
Licence
CC BY 4.0

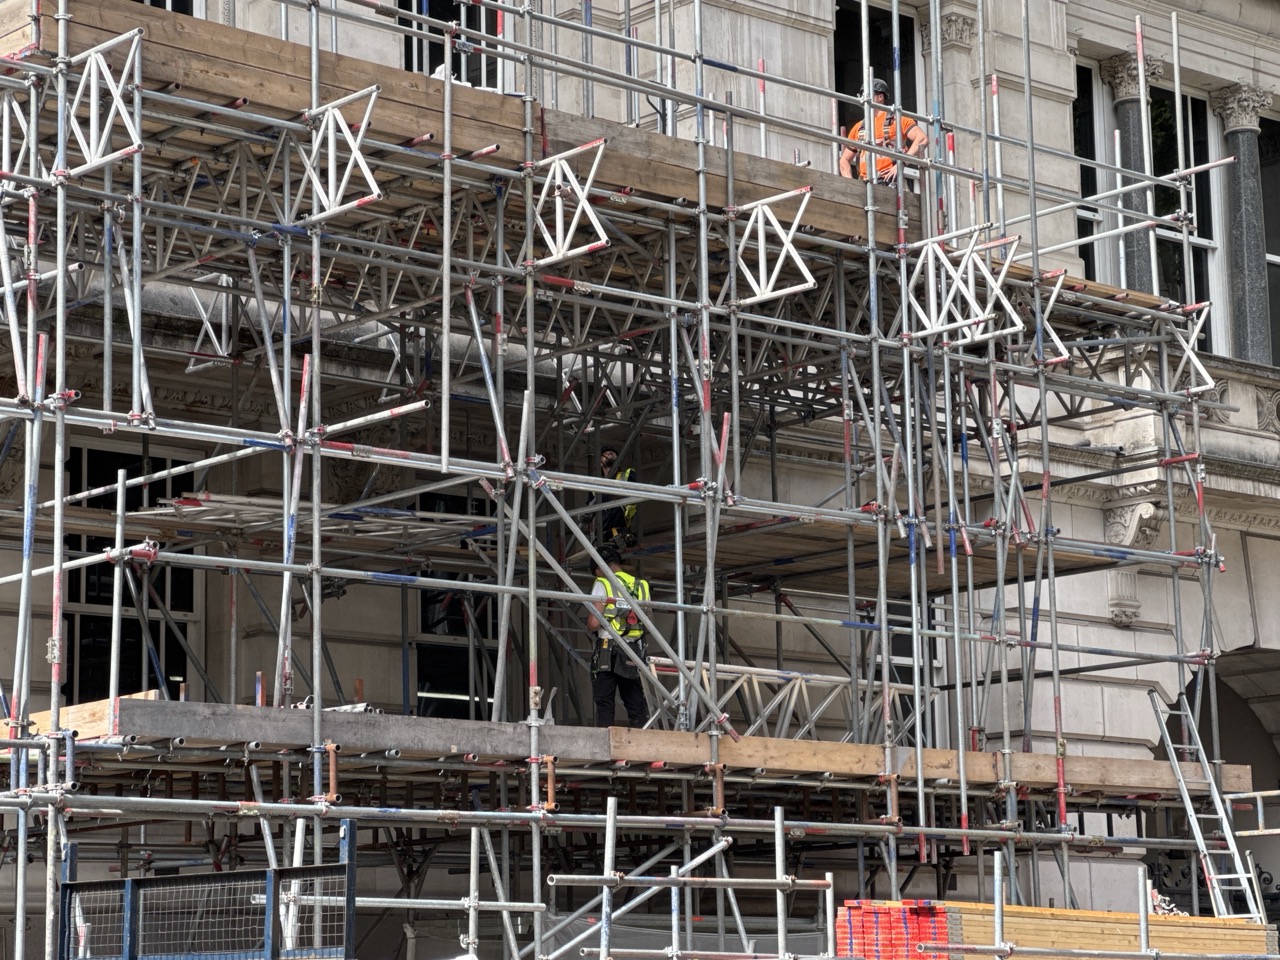
How Loud Is Setting Up a Scaffold? It is an everyday sight on a city street — but how much noise does building a scaffold actually generate? This SPL Reference measurement captures workers assembling scaffolding alongside an urban road. Metal poles and fittings being moved, positioned and struck create repeated sharp impacts, mixed with traffic and the normal background of the city. What makes this sound particularly noticeable is not necessarily a continuous high level, but the succession of sudden metallic peaks interrupting the surrounding ambience. A good example of how an ordinary urban activity can temporarily transform the acoustic character of a street. Environment: Urban street Activity: Scaffold assembly Soundscape: Metallic impacts, construction activity and road traffic Measurement type: Real-world urban / construction noise

Public photograph for Escalator - City Thameslink Station
Metro Station

Escalator - City Thameslink Station

London, United Kingdom

LAeq
78.6 dB
LAFmax
82.4 dB
LCpeak
98.6 dB
Duration
0:19
Measurement details
Environment
Transport · Metro Station
LAFmin
75.3 dB
LCeq
84.9 dB
LZeq
85.4 dB
Calibration
Uncalibrated
Quality
Indicative
Contributor
Anonymous
Licence
CC BY 4.0

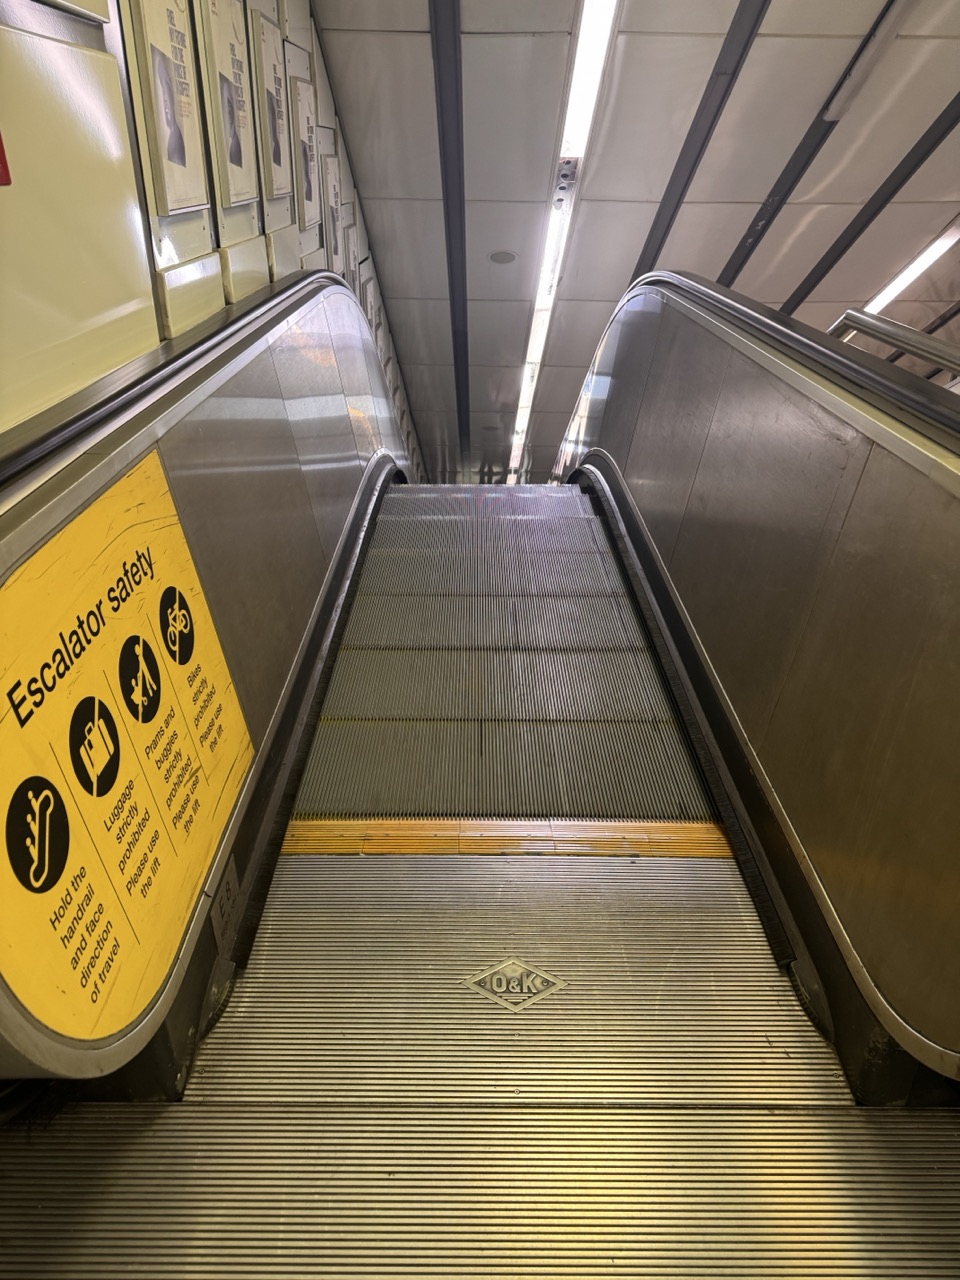
How Surprisingly Noisy Can an Escalator Be? An escalator may seem like an insignificant source of noise, but how loud does it actually get? This measurement lasts less than a minute, yet after being exposed to noise for much of the journey, the continuous mechanical sound of the escalator feels surprisingly intrusive and annoying. A small, everyday example of how sound level, duration and previous exposure can shape our perception of noise.

Public photograph for A Short Walk Around St Paul’s — London
Pedestrian Street

A Short Walk Around St Paul’s — London

London, United Kingdom

LAeq
75.6 dB
LAFmax
90.8 dB
LCpeak
115.4 dB
Duration
1:18
Measurement details
Environment
Streets Roads · Pedestrian Street
LAFmin
62.9 dB
LCeq
86.3 dB
LZeq
87.1 dB
Calibration
Uncalibrated
Quality
Indicative
Contributor
John Brown
Licence
CC BY 4.0

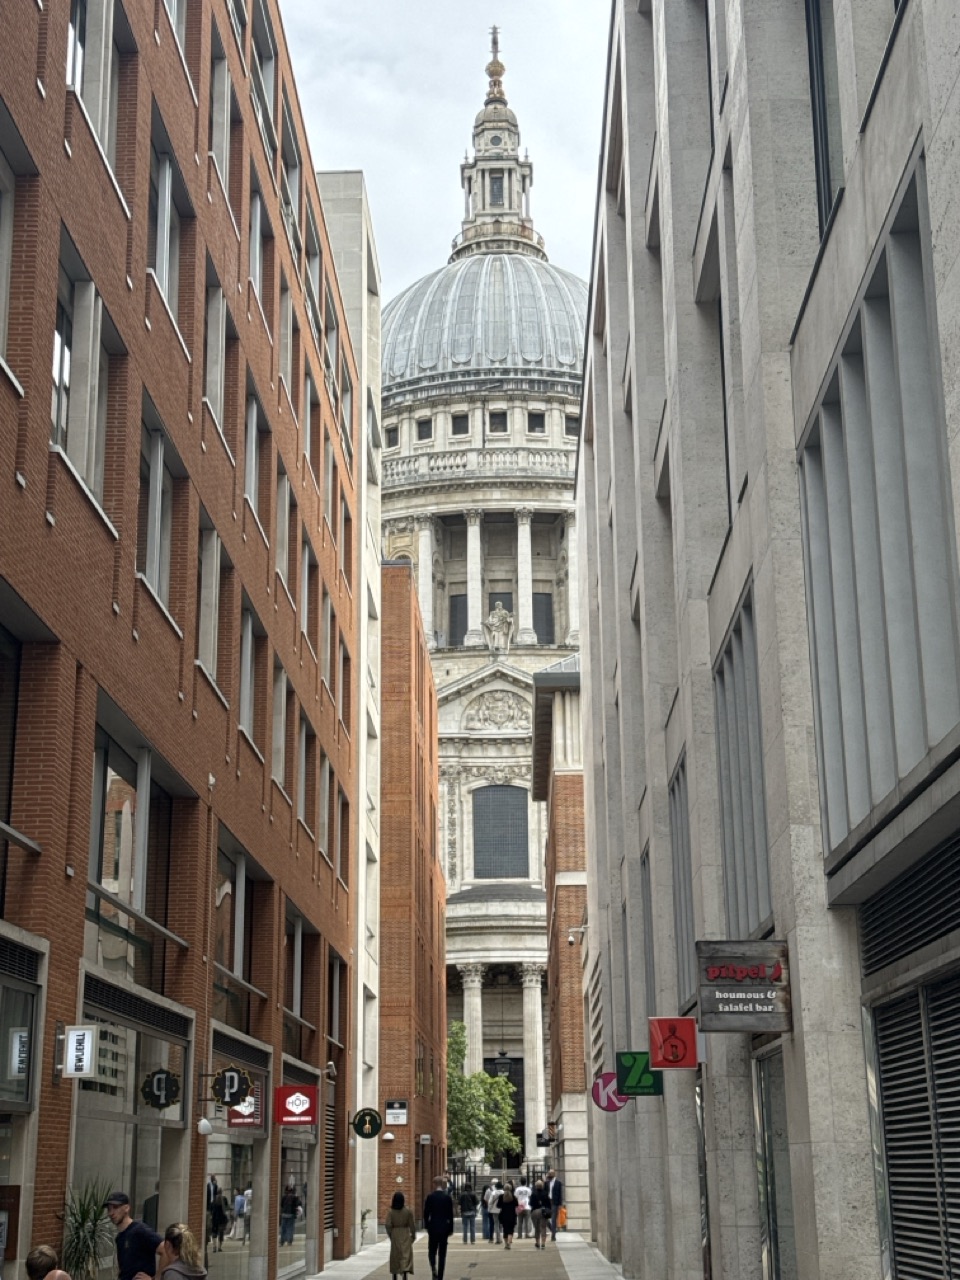
What does central London actually sound like when you simply walk through it? This short SPL Reference measurement captures a walk around St Paul’s, where traffic, pedestrians, voices and the wider urban background continuously overlap and change as you move through the area. Rather than measuring a single noise source, it records the acoustic experience of moving through one of London’s busiest urban environments — a brief snapshot of the sound levels that form part of everyday city life.

Public photograph for Surprisingly Quiet Coffee Shop
Coffee Shop

Surprisingly Quiet Coffee Shop

London, United Kingdom

LAeq
70.5 dB
LAFmax
96.0 dB
LCpeak
113.9 dB
Duration
36:05
Measurement details
Environment
Food Drink · Coffee Shop
LAFmin
56.9 dB
LCeq
75.7 dB
LZeq
76.1 dB
Calibration
Uncalibrated
Quality
Indicative
Contributor
Michelangelo Canonico
Licence
CC BY 4.0

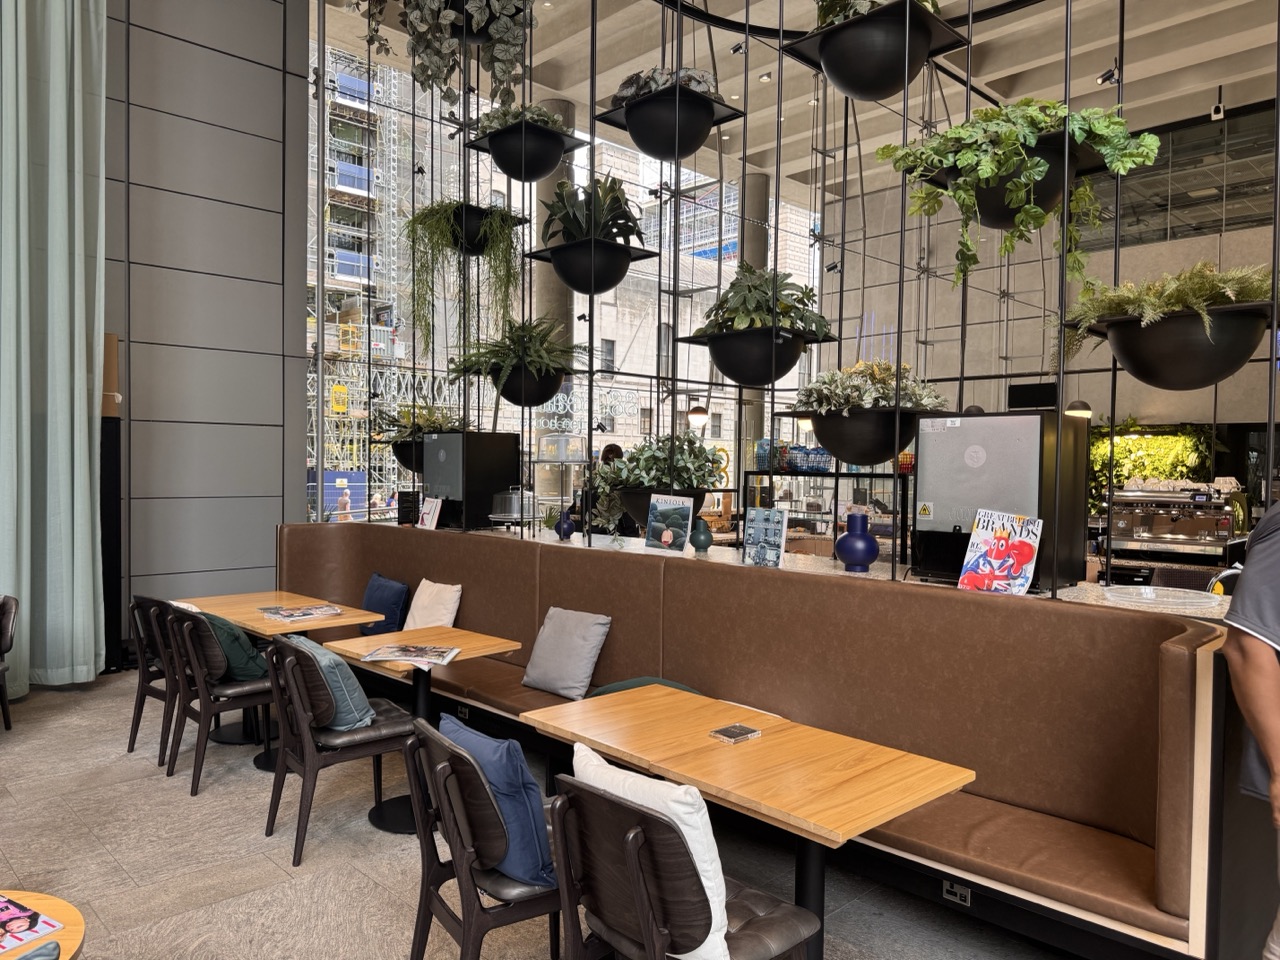
A beautiful coffee shop, a relaxed conversation and some background music — how quiet is “quiet” when we actually measure it? This measurement captures a pleasantly calm café environment during a conversation. Music plays softly in the background, with a noticeable bass presence, while the coffee machine and occasional sounds from customers and the surrounding space create brief changes in level. An interesting example of how a place can feel quiet and comfortable even when its soundscape is far from silent.

Canteen

Quick Lunch In The Canteen

London, United Kingdom

LAeq
84.0 dB
LAFmax
99.5 dB
LCpeak
112.2 dB
Duration
14:31
Measurement details
Environment
Food Drink · Canteen
LAFmin
63.7 dB
LCeq
85.7 dB
LZeq
85.7 dB
Calibration
Uncalibrated
Quality
Indicative
Contributor
Anonymous
Licence
CC BY 4.0

A normal lunch break with two colleagues in a busy company canteen. No particularly loud event, no machinery dominating the room, no obvious source of excessive noise — just the usual combination of conversations, movement, cutlery and the constant background of a shared dining space. And yet, the overall sound environment felt surprisingly uncomfortable. This SPL Reference measurement captures an interesting aspect of everyday noise exposure: sometimes it is not a single loud event that matters, but the continuous accumulation of many ordinary sounds happening at the same time.

Public photograph for Office Fire alarm
Open Plan Office

Office Fire alarm

London, United Kingdom

LAeq
85.2 dB
LAFmax
95.1 dB
LCpeak
105.9 dB
Duration
1:06
Measurement details
Environment
Office Work · Open Plan Office
LAFmin
47.2 dB
LCeq
83.8 dB
LZeq
84.0 dB
Calibration
Uncalibrated
Quality
Indicative
Contributor
Anonymous
Licence
CC BY 4.0

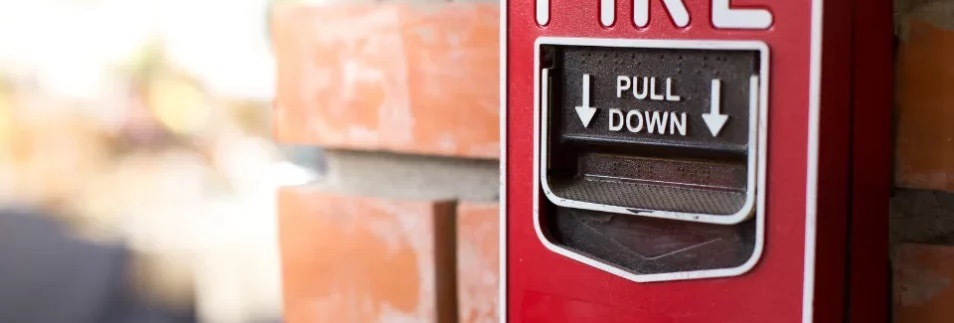
How Loud Is a Fire Alarm Test? Fire alarms are designed to be impossible to ignore. But how loud is one when you are actually standing in the building? This SPL Reference measurement captures a routine fire alarm test in a real indoor environment, recording both the alarm itself and the surrounding sound before and during its activation. The result provides a real-world reference for the sound level and short-term exposure produced by an emergency warning system, rather than a laboratory measurement of the alarm device.

Public photograph for Whitehorse Meadow
Urban Park

Whitehorse Meadow

London, United Kingdom

LAeq
59.7 dB
LAFmax
78.2 dB
LCpeak
108.1 dB
Duration
4:20
Measurement details
Environment
Nature Outdoors · Urban Park
LAFmin
42.7 dB
LCeq
77.0 dB
LZeq
79.8 dB
Calibration
Calibrated
Quality
Device Calibrated
Contributor
Alex
Licence
CC BY 4.0

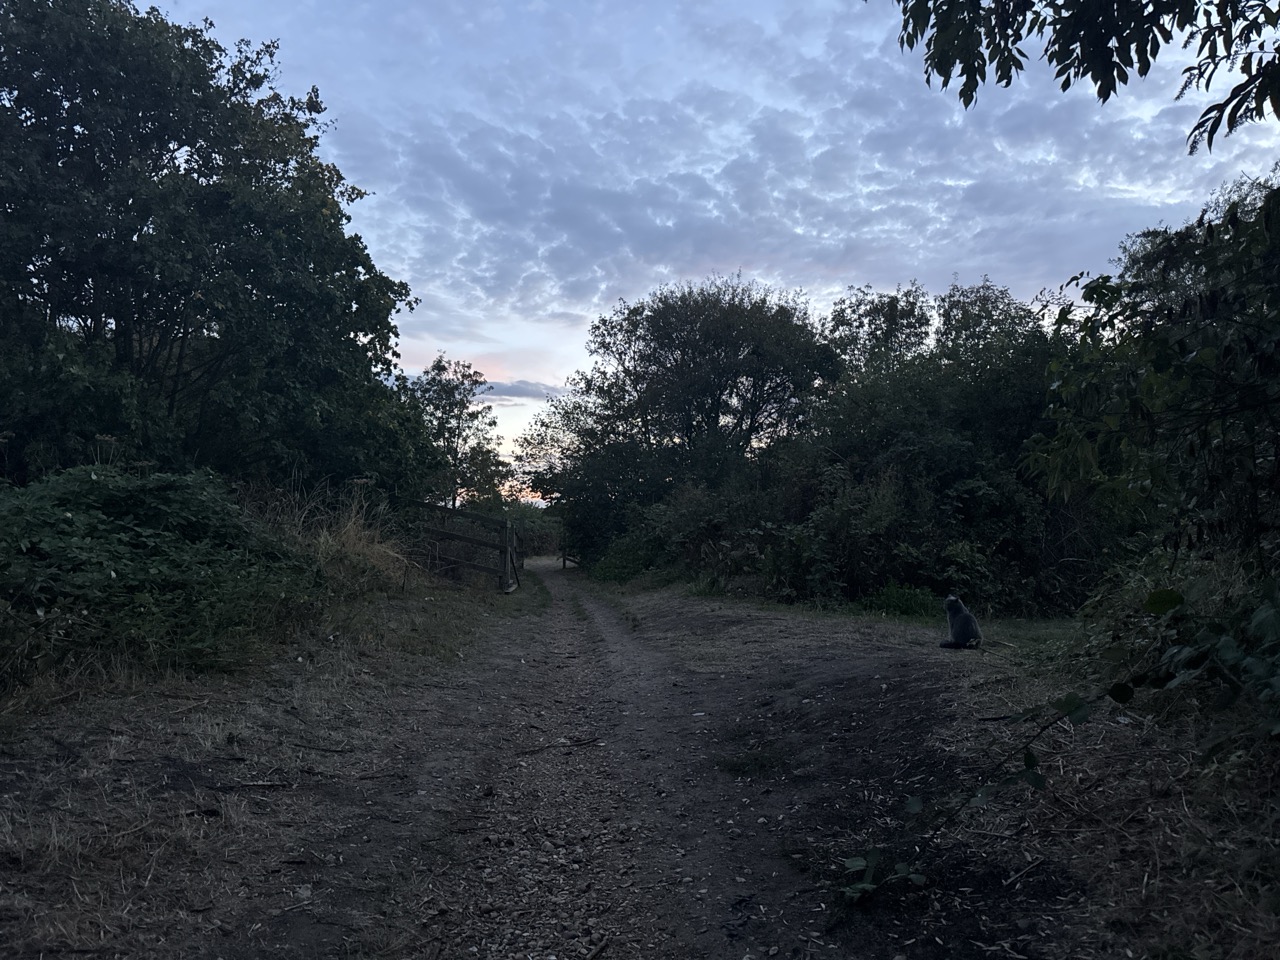
Evening Walk — Whitehorse Meadow, London, UK Environmental sound pressure level measurement recorded during an evening walk across Whitehorse Meadow at approximately 8 PM. The measurement captures the changing sound environment experienced while walking through an open urban green space, including the natural background ambience, footsteps and movement, distant road traffic, occasional voices and other human activity, birds and other wildlife, wind and vegetation, and intermittent sounds originating from the surrounding residential and urban environment. Unlike a measurement taken from a fixed position, this recording documents sound exposure while moving through the environment. As the walking route changes the distance and orientation relative to individual sound sources, the measurement provides a representation of the acoustic experience of crossing the park rather than the sound level of one specific location within it. The measurement forms part of the SPL Reference real-world environmental dataset, providing a useful quieter outdoor reference for comparison with streets, railway stations, public transport, workplaces, indoor environments and other everyday soundscapes.

Public photograph for City Thameslink Station
Railway Platform

City Thameslink Station

London City, United Kingdom

LAeq
83.6 dB
LAFmax
97.8 dB
LCpeak
109.8 dB
Duration
9:26
Measurement details
Environment
Transport · Railway Platform
LAFmin
57.2 dB
LCeq
85.6 dB
LZeq
85.8 dB
Calibration
Uncalibrated
Quality
Indicative
Contributor
Anonymous
Licence
CC BY 4.0

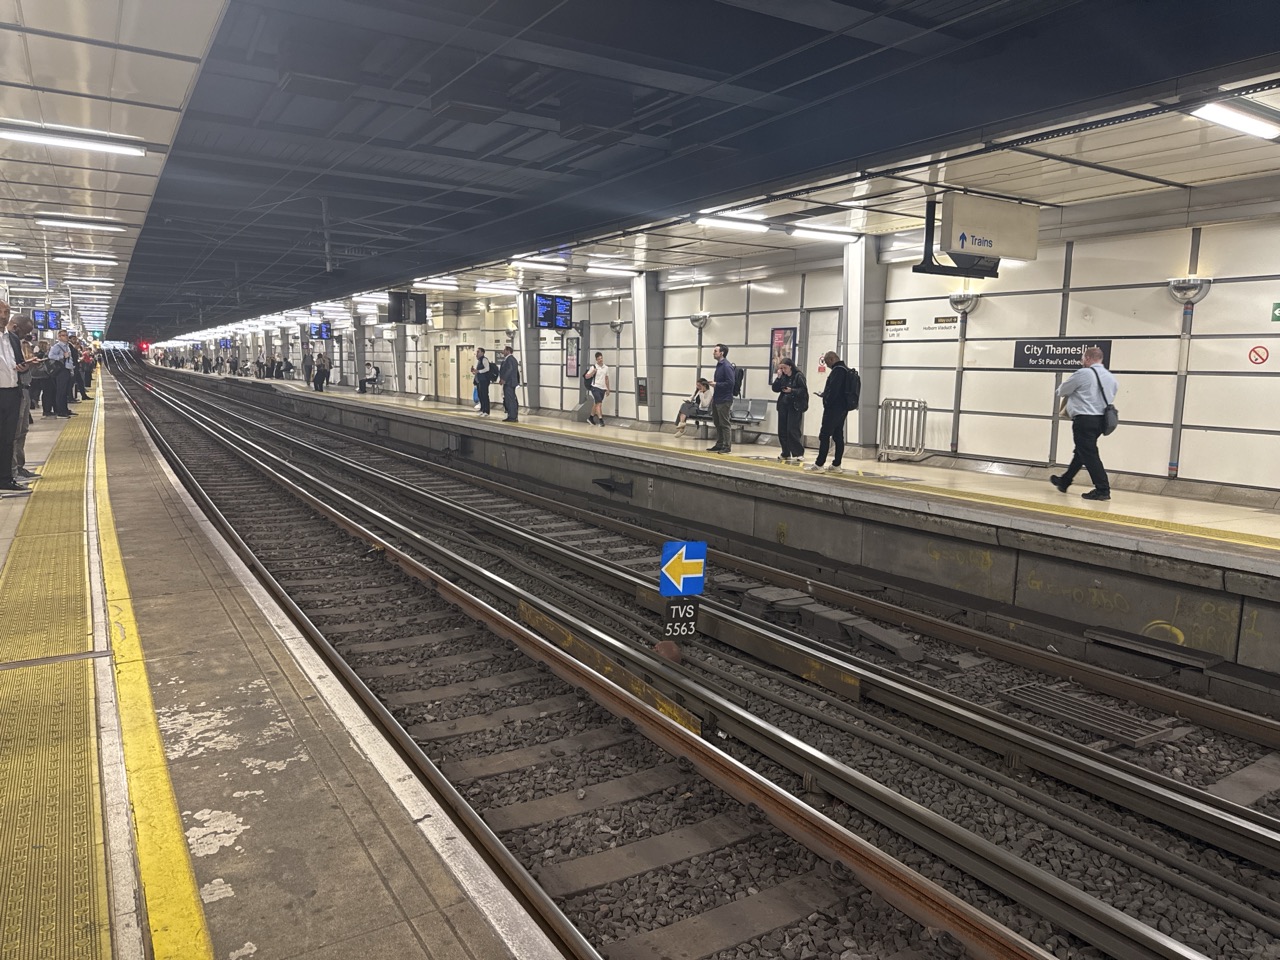
Environmental sound pressure level measurement recorded while waiting for approximately 10 minutes on Platform 1 at City Thameslink railway station in central London. The measurement captures the acoustic environment experienced by a passenger during a typical waiting period, including the continuous background noise of the station, ventilation and infrastructure, passenger activity, announcements, and the substantial variations in sound level produced by trains approaching, arriving, stopping, and departing from the platform. The enclosed underground platform environment is particularly relevant to this measurement, as train noise and other transient sounds interact with the reflective surfaces and confined geometry of the station. The approximately 10-minute measurement period provides a useful representation of real-world passenger noise exposure while waiting for a train and forms part of the SPL Reference real-world environmental dataset, allowing comparison with outdoor railway platforms, onboard train journeys, other public transport environments, and everyday urban noise.

Open Plan Office

Office Open space

London, United Kingdom

LAeq
57.3 dB
LAFmax
87.1 dB
LCpeak
103.9 dB
Duration
1:00:01
Measurement details
Environment
Office Work · Open Plan Office
LAFmin
43.9 dB
LCeq
63.0 dB
LZeq
63.8 dB
Calibration
Uncalibrated
Quality
Indicative
Contributor
Anonymous
Licence
CC BY 4.0

Environmental sound pressure level measurement recorded continuously for approximately one hour in the open-plan office of a large financial institution in London. The measurement captures the typical acoustic environment experienced during everyday office work, including conversations, telephone and video calls, movement through the workspace, keyboards and office equipment, ventilation systems, and the cumulative background sound generated by a large number of people sharing an open space. Unlike measurements dominated by individual high-level events, this recording is intended to document sustained everyday workplace noise exposure. The one-hour duration captures both quieter periods and temporary increases in activity, providing a more representative picture of the changing sound environment experienced by someone working in the space. The measurement forms part of the SPL Reference real-world environmental dataset, providing a reference for comparison with other workplaces, public spaces, transport environments, domestic settings, and urban locations.

Public photograph for Thameslink Journey - Norwood Junction to London Bridge
Train

Thameslink Journey - Norwood Junction to London Bridge

London, United Kingdom

LAeq
67.7 dB
LAFmax
94.9 dB
LCpeak
108.2 dB
Duration
12:16
Measurement details
Environment
Transport · Train
LAFmin
60.3 dB
LCeq
81.7 dB
LZeq
86.0 dB
Calibration
Calibrated
Quality
Device Calibrated
Contributor
Anonymous
Licence
CC BY 4.0

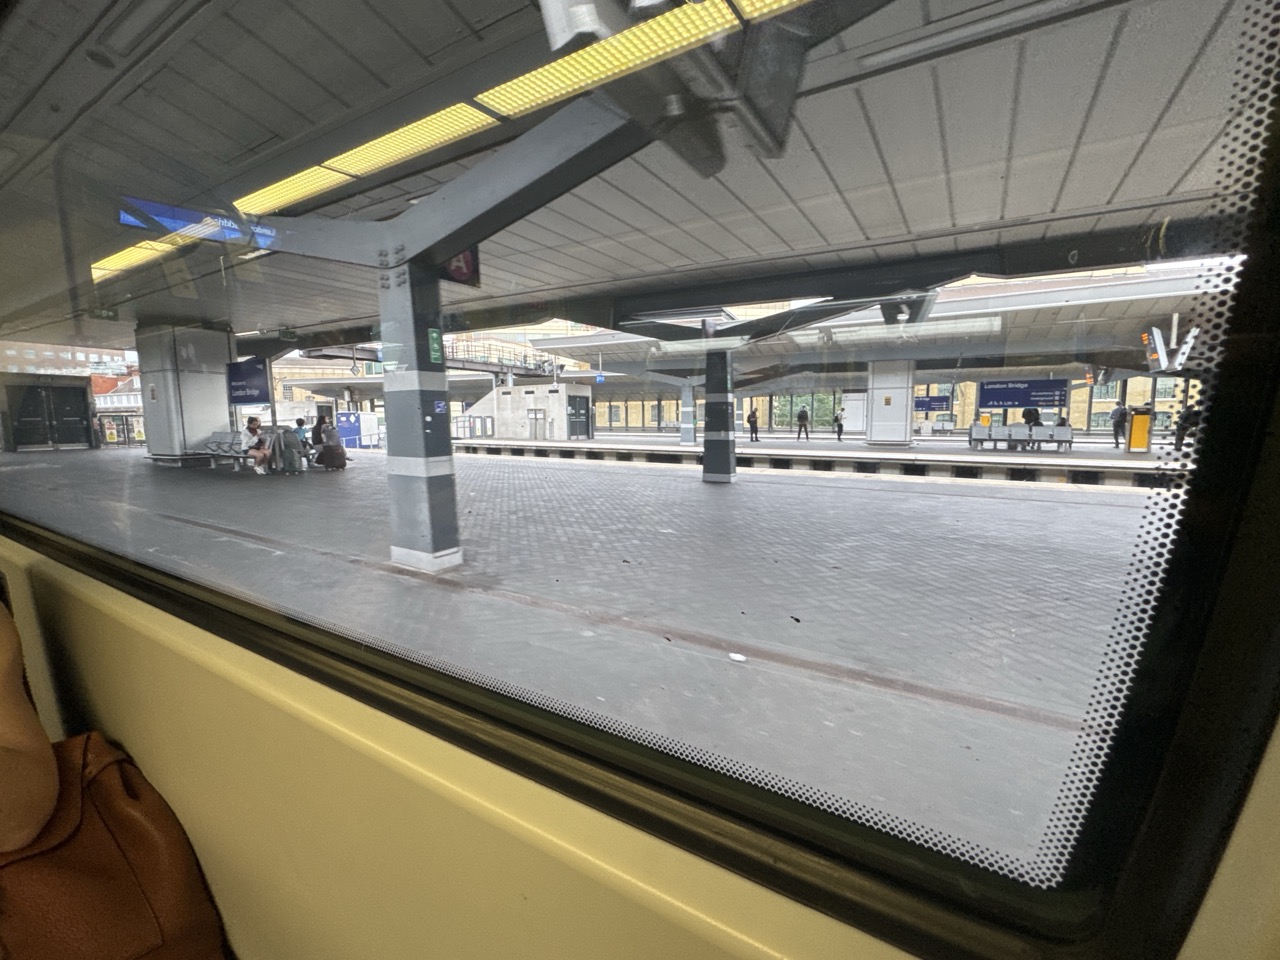
Environmental sound pressure level measurement recorded during a typical passenger journey aboard a Thameslink train travelling from Norwood Junction to London Bridge. The measurement captures the changing acoustic environment experienced inside the passenger carriage throughout the journey, including acceleration and braking, continuous rolling and rail noise, track and wheel interaction, changes in speed, station approaches, and the transition from the suburban rail network towards central London. Rather than representing a controlled acoustic test, this recording documents real-world passenger noise exposure during everyday public transport. It provides a reference for comparing typical and peak sound levels encountered during rail travel with measurements collected in other transport systems, public spaces, urban environments, and everyday listening situations.

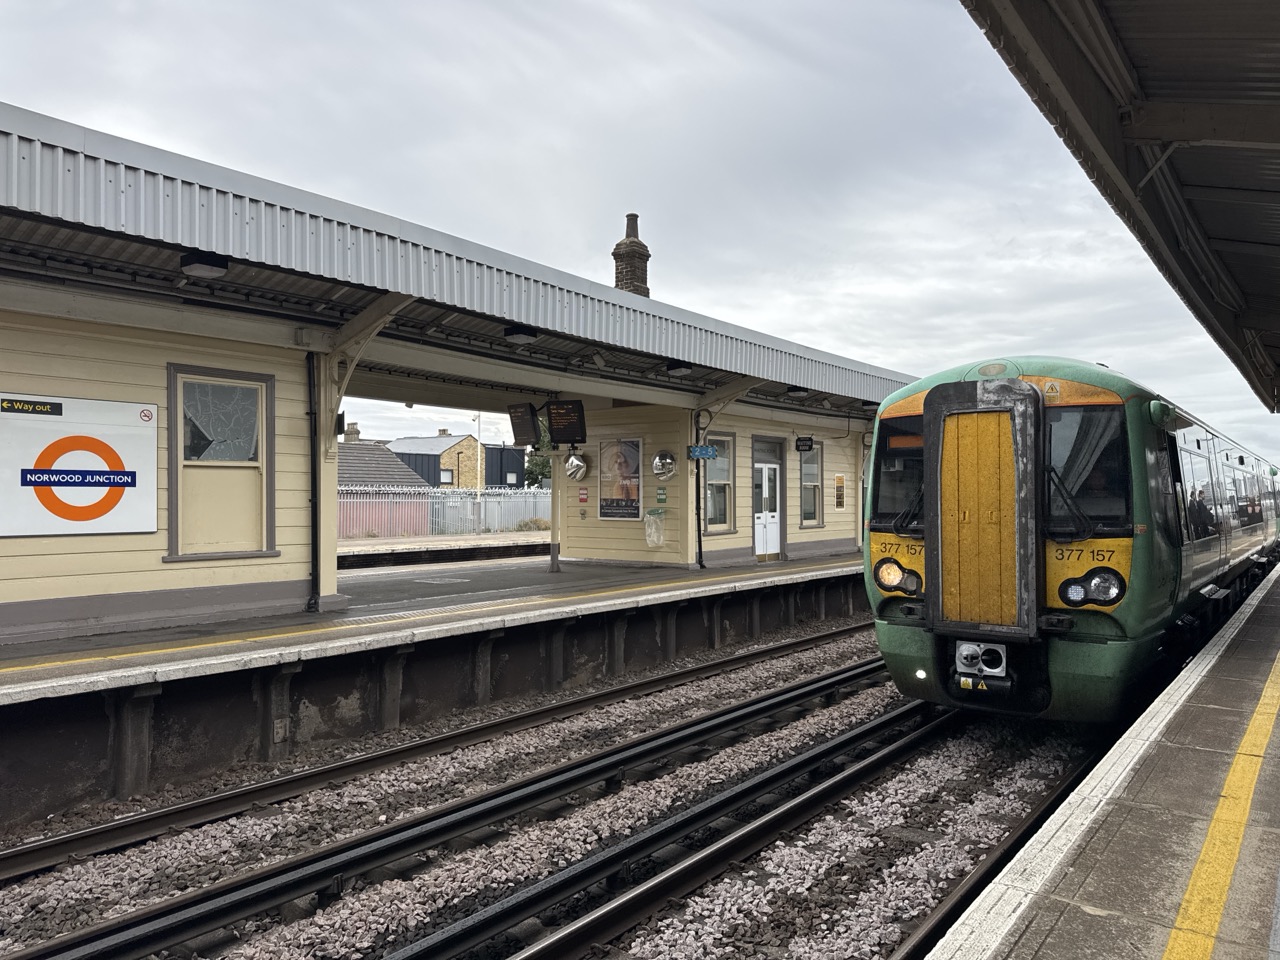
Public photograph for Norwood Junction Train Station
Railway Platform

Norwood Junction Train Station

South Norwood, United Kingdom

LAeq
78.2 dB
LAFmax
96.0 dB
LCpeak
110.3 dB
Duration
4:39
Measurement details
Environment
Transport · Railway Platform
LAFmin
47.2 dB
LCeq
82.7 dB
LZeq
84.1 dB
Calibration
Calibrated
Quality
Device Calibrated
Contributor
Anonymous
Licence
CC BY 4.0

Environmental sound pressure level measurement recorded while seated on a bench on Platform 3 at Norwood Junction railway station, while waiting for a train. The measurement captures the everyday acoustic environment experienced by a passenger on the platform, including background station ambience, nearby rail activity, arriving and departing trains, announcements, passenger activity, and intermittent changes in sound level associated with trains moving through or around the station. Unlike an onboard measurement, this recording documents stationary noise exposure in an active railway environment, where relatively quiet background periods can be interrupted by much louder short-duration events. The measurement forms part of the SPL Reference real-world environmental dataset, providing a reference for comparing railway-platform noise with onboard transport, urban environments, public spaces, workplaces, and other everyday sound environments.

Home

Domestic Vacuum Cleaning

Location withheld

LAeq
83.6 dB
LAFmax
97.6 dB
LCpeak
123.9 dB
Duration
4:19
Measurement details
Environment
Residential · Home
LAFmin
39.1 dB
LCeq
83.4 dB
LZeq
84.4 dB
Calibration
Uncalibrated
Quality
Indicative
Contributor
Anonymous
Licence
CC BY 4.0
Public photograph for Gypsy Hill Market
Outdoor Market

Gypsy Hill Market

London, United Kingdom

LAeq
63.7 dB
LAFmax
84.1 dB
LCpeak
106.9 dB
Duration
3:01
Measurement details
Environment
Retail Commercial · Outdoor Market
LAFmin
51.1 dB
LCeq
73.9 dB
LZeq
75.1 dB
Calibration
Uncalibrated
Quality
Indicative
Contributor
Michelangelo Canonico
Licence
CC BY 4.0

London - Gypsy Hill

Pub

Dinner At Funnies pub

Sapri, Italy

LAeq
49.3 dB
LAFmax
83.5 dB
LCpeak
106.0 dB
Duration
43:59
Measurement details
Environment
Food Drink · Pub
LAFmin
40.8 dB
LCeq
55.5 dB
LZeq
56.1 dB
Calibration
Uncalibrated
Quality
Indicative
Contributor
Michelangelo Canonico
Licence
CC BY 4.0

This measurement was taken during an evening dinner with friends at Funny’s Pub in Sapri, southern Italy. It represents a typical social dining environment rather than a controlled acoustic test: several people were talking around the table while normal restaurant activity continued in the background, including nearby conversations, staff movement, tableware and the general ambience of the venue. The recording is therefore intended as a snapshot of the real-world sound level experienced by a guest during a lively but ordinary evening out. Measurements like this can be useful when comparing everyday leisure environments and understanding how conversational noise, music and room occupancy combine to create the acoustic character of restaurants and pubs.

Nightclub

Elayon Club Residence - Disco Night Outside

Villammare, Italy

LAeq
89.3 dB
LAFmax
106.5 dB
LCpeak
130.5 dB
Duration
54:11
Measurement details
Environment
Music Nightlife · Nightclub
LAFmin
72.5 dB
LCeq
91.4 dB
LZeq
91.4 dB
Calibration
Uncalibrated
Quality
Indicative
Contributor
Michelangelo Canonico
Licence
CC BY 4.0

This measurement was taken outdoors at night from a residential property located close to Elayon Club Residence, a nearby tourist village where amplified music was being played during the evening. Unlike a measurement taken inside the entertainment venue itself, this recording represents the sound as experienced from the surrounding residential area. The measured level therefore reflects not only the music source, but also the effects of distance, outdoor propagation, local geography and the general nighttime background environment. This type of measurement can provide useful context when documenting how leisure and tourist activities contribute to the acoustic environment beyond the boundaries of the venue itself, particularly during evening and nighttime hours when background sound levels are generally lower.